What to expect from the second half of this beef price cycle
The last half of the current beef price cycle is going to require an all-out focus on lowering costs of production.
November 6, 2018
My last two Market Adviser columns focused on the economic performance of North Dakota Farm Business Management beef cow herds over the first nine years (2009-17) of the current cattle cycle. I took a detailed look at the nine-year averages and the nine-year trends. Let me summarize the economics of the first nine years (2009-17) of the current cycle (Figure 1).
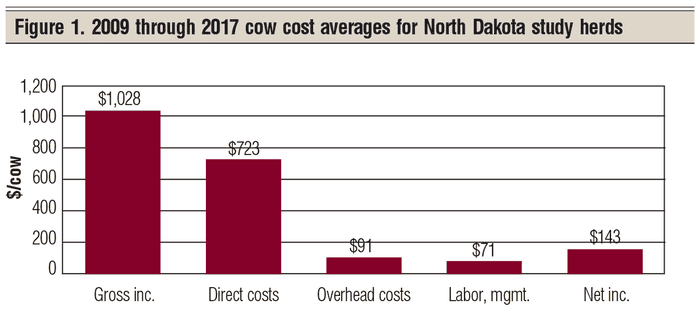
Gross income per cow over those nine years averaged $1,028 per cow — not bad. This included calf sales and cull animal sales. Cull sales are a significant — and, I argue — critical part of gross income and net income from beef cows.
Direct costs over those nine years average $723 per cow. This included direct production costs such as winter feed, summer pasture, vet and medicine, etc. Direct costs collectively absorbed 70% the gross income per cow. One big cost included was for heifer replacement and bull replacement.
Farm-raised feed costs are figured at fair market value, and pasture costs are figured at the going pasture rental rates. Farming profits (or losses) on the farm-raised feeds are not considered in this analysis. The economics of raising farm fed feeds will be a subject of another Market Adviser series.
Overhead costs include custom hire, hired labor, farm insurance, utilities, interest, machine and building depreciation, and a miscellaneous category. The nine-year average overhead cost for these study herds was $91 per cow. This comes out to a nine-year average of 9% of gross income per cow.
Labor and management calculate out to an average of $71 per cow for the first nine years of the current cycle. This averages out to 7% of gross income.
The calculated net income per cow averages $143 per cow per year over these nine years. Not bad! Now, can we duplicate this in the second half of the beef price cycle?
Second-half outlook
Figure 2 provides a clue to my answer to the question above. Without year 2014, the peak price year, the other eight years generated a net income average of $81.50 per cow per year. That one year (2014) raised the yearly average of $61.50 to a total of $143 per cow per year.
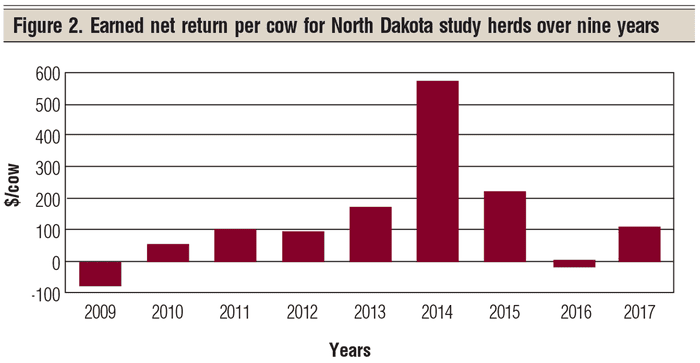
There is nothing in the cards suggesting anything like 2014 for the rest of this beef price cycle (2018 through 2020). Theoretically, the next possible price peak could be around 2026-27. No, this is not a sure thing, but it is my best projection as this is being written.
A second factor that enters into economic returns from beef cows in the downward side of the current beef price cycle is the fact that production costs have trended upward over the first nine years of the current cycle (Figure 3).
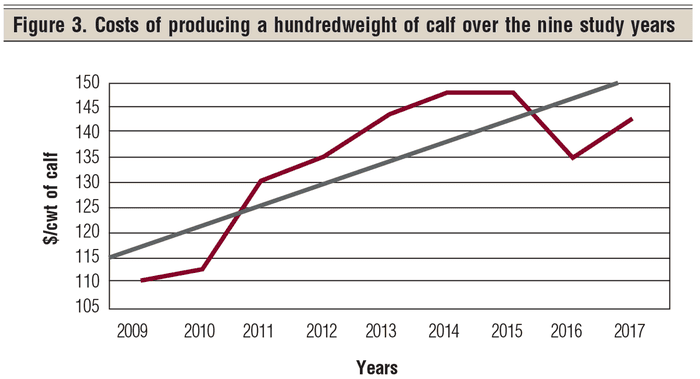
While the nine-year trend for cost per hundredweight of calf produced went upward only $4.15 per cwt per year, the important point here is that production costs have a history of going up. What is going to cause production costs to go down in the second half of this cycle?
The only two ways to reduce the upward trend of production costs per hundredweight of calf produced is to increase the pounds of calf produced per cow or reduce total production costs. Neither is easy to do.
If it was easy, it would have already been done — but we did do it in 2016! Maybe that was by reducing the cost of replacement females and replacement bulls. Yes, the data support that statement.
Let me plant some seeds as to where I am going with this series of articles. Figure 4 presents the last nine years of history plus my current set of projected long-run calf prices based on the latest FAPRI (Food and Agriculture Policy Research Institute) price projections with my modifications (see red line). The black line is the last nine years of cost of production data from North Dakota beef cow herds.
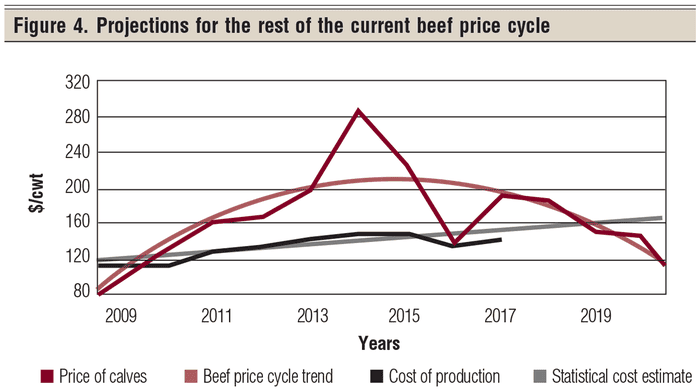
There are two statistical trend lines presented in the chart. The curved red line is a statistical estimate of the current beef price cycle from 2009 through 2020. The straight black line is a statistical estimate of the cost of producing a hundredweight of calf for these North Dakota herds. The two trend lines cross in 2019, suggesting that we could see the average profit for these beef herds go to zero.
If the current trend in beef exports continues into 2019, we might not see the zero earned net returns projected for 2019. In any case, however, I am projecting considerable economic pressure on beef cow operations for 2019 through 2021.
The last half of the current beef price cycle is going to require an all-out focus on lowering costs of production.
Hughes is a North Dakota State University professor emeritus. He lives in Kuna, Idaho. Reach him at 701-238-9607 or [email protected].
About the Author(s)
You May Also Like




.png?width=300&auto=webp&quality=80&disable=upscale)
