Trying to precisely pinpoint ending stocks for this summer’s crop is a challenging proposition. That’s because there are multiple inputs; some of which are dependent upon one another.
July 5, 2018

At this early stage in the growing/crop marketing season, trying to precisely pinpoint ending stocks for this summer’s crop is a challenging proposition – it’s about like solving non-linear algebraic equations. That’s because there are multiple inputs; some of which are dependent upon one another.
Ending stocks (often referred to also as carryover or carryout) is a function of carry-in (ending stocks) from the previous marketing year, imports, acres planted, harvest rate, yield and total use. And what makes all this particularly challenging is that some variables are dependent upon others. Most notably, if crop production is low, price will rise to ration demand and total use will also decline.
As such, there’s really no perfect answer. To that end, though, most of the industry keys off USDA’s monthly WASDE report to get a rough baseline for ending stocks/carryover and ultimately some idea of market price – more on that next week. The key word being “baseline” – there’s always lots of discussion/controversy around USDA’s projections, leaving the door open for variation in private estimates (thus, making a market).

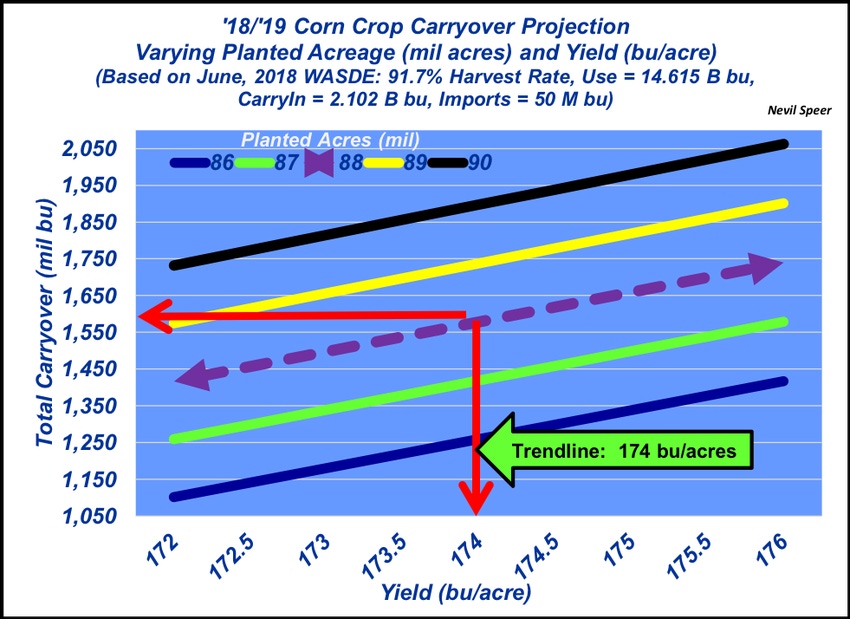
Nevertheless, USDA currently has U.S. farmers planting 88 million acres and projecting corn yield right at trend line estimates of 174 bushels per acre in the June report. Meanwhile, total use is projected at 14.62 billion bushels. That will be updated July 12 with new acreage numbers; USDA now has U.S. farmers planting just a little north of 89 million acres. And then the real challenge will be projecting potential yield as summer progresses.
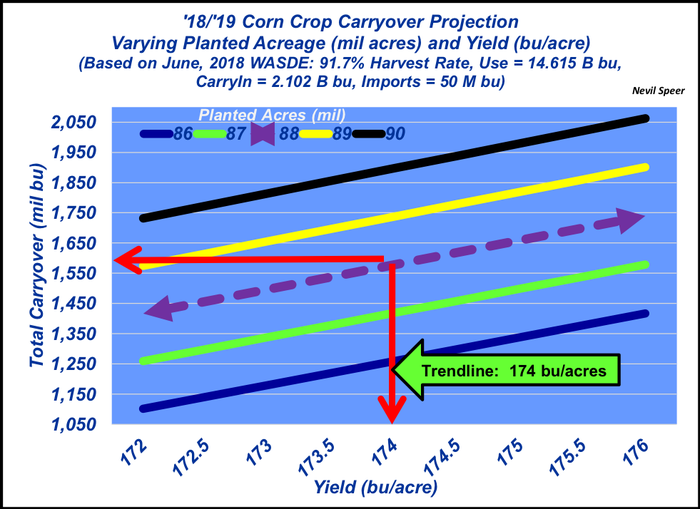
Bottom line: Right now, USDA is projecting 2019 ending stocks at 1.58 billion bushels, down sharply from the 2018 estimation of 2.10 billion bushels. This week’s graph highlights varying carryover depending upon differences in planted acres and yield.
How do you foresee this year’s corn crop shaping up? Do you foresee upward adjustments to total acres planted and/or potential deviations from trendline yield? Are you making plans accordingly? Leave your thoughts in the comments section below.
Nevil Speer serves as an industry consultant and is based in Bowling Green, KY. Contact him at [email protected].
About the Author(s)
You May Also Like


