Benchmarking can help you focus your limited management time on the critical areas of your beef cow business.
July 31, 2017
Each year, North Dakota State University publishes a yearly beef cow economic and production business summary. This is part of North Dakota’s Farm Business Management Program (ND-FBM). operated through North Dakota’s Statewide educational system.
The U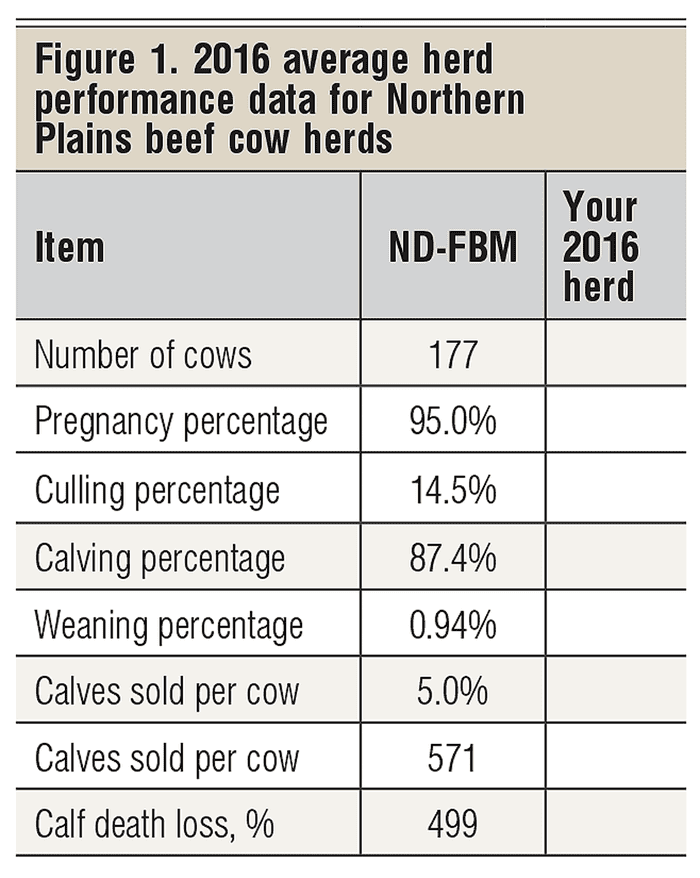
Do a Google search for FINBIN and you can access this database for any one of these 11 states or an aggregate summary of all 11 states. FINBIN is a very powerful farm and ranch management tool and should be used by ranchers in conducting a benchmark analysis of their own beef cow business.
Annually, I publish a detailed analysis of North Dakota’s beef cow enterprise summary taken from North Dakota’s annual report. This discussion uses the 2016 averages of the 64 participating North Dakota herds. Each table has space for you to add actual numbers for your herd as a way to benchmark your beef cow herd against these published Northern Plains averages.
Ranchers are busy, busy people — often doing all the ranch labor, leaving only a limited amount of time for ranch management. So, how do you decide where to focus your limited management time? Benchmarking can help you focus your limited management time on the critical areas of your beef cow business.
Categories where your herd beats the study herds’ averages point to the strengths of your beef cow herd. Capitalize on these strengths! Categories where the published averages beat your herd’s numbers identify potential areas to focus your management attention on, with the goal of improving overall profitability of the herd.
Let’s start this benchmarking discussion by looking at some critical average herd performance data. Figure 1 presents the averages of these Northern Plains 64 study herds. Most of these ranchers farm as well as running an average of 177 cows per herd. Livestock sales, on average, were about 39% as large as crop sales.
The National Integrated Resource Management standards are used to calculate the reproductive measures of the beef cow herds presented in Figure 1. The two most critical production numbers, in my opinion, are pregnancy percentage (95.0%) and weaning percentage (87.4%).
The base of these two percentages is the number of females exposed to the bulls at turnout time in the previous year’s breeding season. Many ranchers tend to base these percentages on the number of cows in the Dec. 31 inventory — after they have culled the open cows. Do not base these percentages on cow numbers at the end of the year.
What is highly correlated to profit is this: Of all the females exposed at bull turnout time (mature cows and virgin heifers), what percent of these females weaned a calf in the fall of the following year?
In this database, 87.4% of females exposed to the bulls in 2015 weaned a calf in 2016. My past IRM data have shown this is a critical number with respect to beef cow profits.
A lot can happen in a herd from breeding until weaning the next year. There can be pregnancy loss, females dying, females culled for other reasons, calves born dead and live-born calves dying. What is critical from a profit standpoint is the percent of the cows weaning a live calf. The more, the better.
Another number that I concentrate on is calf death loss, which averages 5% in this annual summary. If your number is above that, you have to ask why. What caused the problem?
If the answer is a snowstorm at calving time, there is not much you can do about that. If the answer is sickness, then you need to try and prevent it from happening next year.
The final and most important production number with respect to profitability is pounds weaned per female exposed the year before. Almost all aspects of production performance are summarized in that number. I like to see this number at 500 or higher. This database has 499 pounds weaned per female exposed.
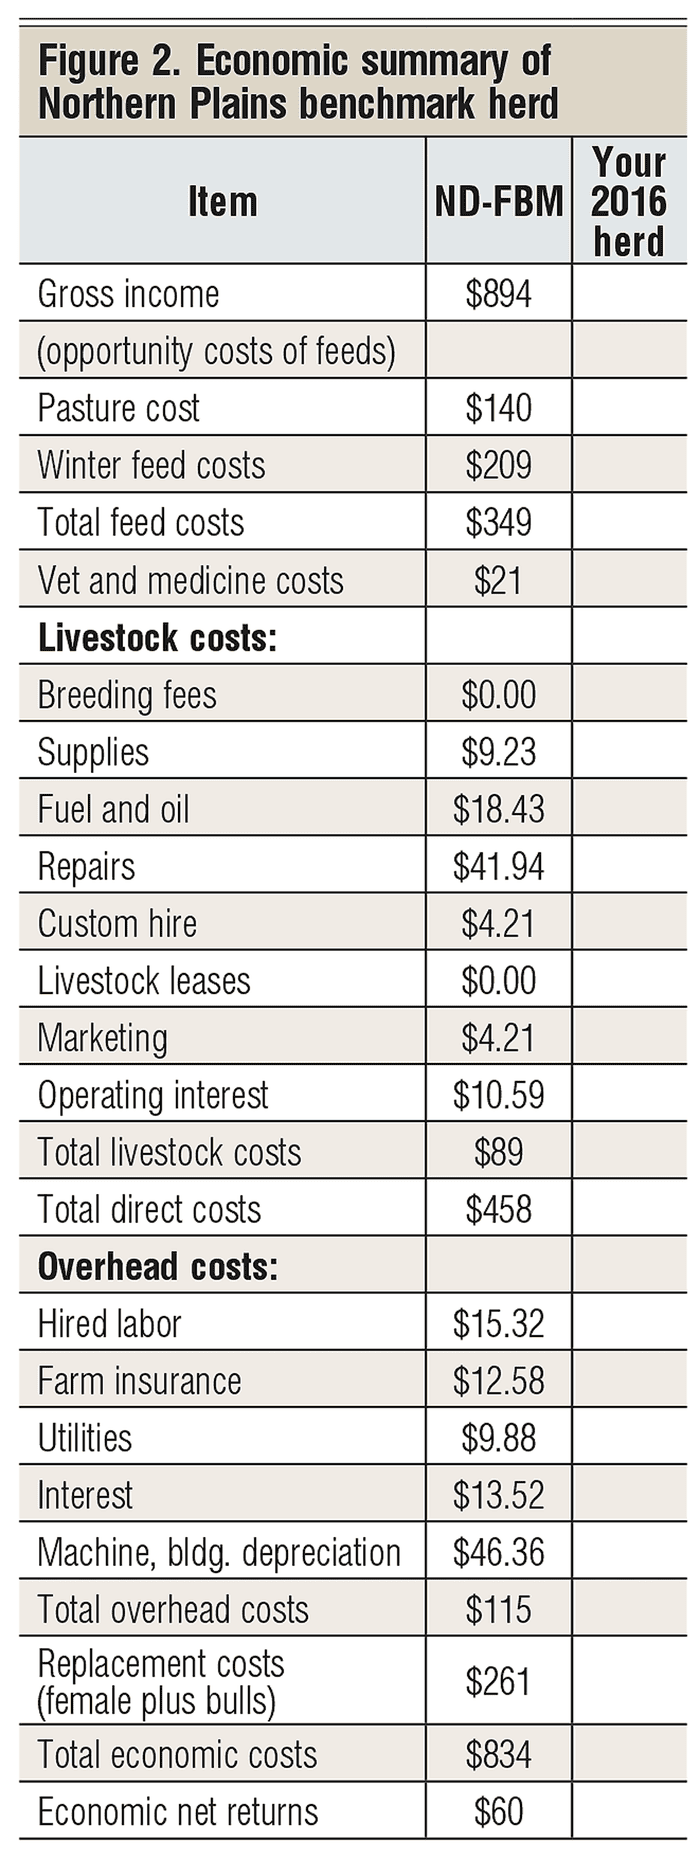
Gross income per cow is made up of beef calves sold, beef calves transferred out and cull sales. The total gross income per cow in this 2016 database averaged $894. Feed costs are broken down into pasture costs at $140 per cow for all summer costs and $209 per cow for winter costs, for a total annual feed cost of $349 per cow.
Depending on your location, your summer and winter feed costs will undoubtedly be quite different, but your annual feed costs should be somewhat comparable.
Vet and medicine costs averaged $21 per cow. This could vary from region to region. The farther north you are, I suspect, the lower this number. The 11-state average for 185 herds in the FINBIN database for 2016 was $25.14.
Total livestock costs listed in Figure 2 averaged $89 per cow. Total direct costs (feed, vet and medicine, and livestock costs) averaged $458 per cow. The beef cow herd’s share of overhead costs came to $115 per cow.
Replacement costs for replacement heifers transferred in, or females purchased and replacement bulls, totaled $261 per cow. The breakdown for the benchmark herds is $116.25 per cow for purchased animals, including bull purchases, and $144.32 per cow for animals transferred in. Total of all economic costs averaged $834 per cow.
Cull sales (cows and bulls) averaged $141 per cow and are part of gross income.
In summary, gross income per cow averaged $894 per cow. Total economic costs averaged $834 per cow, leaving an earned economic net return (before labor and management) of $60 per cow. So, how did your herd perform in 2016?
Let’s compare the $60 average earned economic net return in 2016 with the last 23 years with discussion emphasis on the last 10 years (Figure 3).
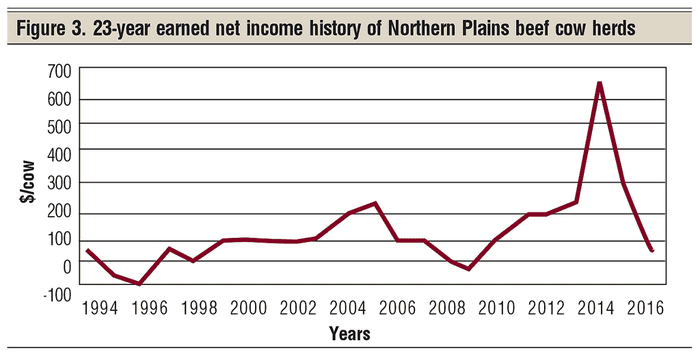
The earned net income (before labor and management) has averaged $180 per cow over the last 10 years. The annual range has been from a −$14 in 2009 to a +$660 in 2014.
As this is being written, I am projecting 2017 to return to approximately the 2015 level — but I think we are still in the expansion phase of the cattle cycle, which suggests that we are still going to have to deal with a larger U.S. calf crop for a few more years in the current cattle cycle. I strongly encourage each of you to benchmark your way through the rest of this cattle cycle.
About the Author(s)
You May Also Like


