Subscribe to Our Newsletters
BEEF Magazine is the source for beef production, management and market news.
September 28, 2012

Gauging the size of the nation’s cowherd is difficult because USDA only publishes estimates of the cowherd semi-annually in its January and July Cattle Inventory reports. Of course, less frequent counts of cattle are understandable since the size of the nation’s cattle herd doesn’t change as quickly as does the hog herd or poultry flocks, species that have shorter biological cycles.
So that leaves us slaughter data from which to judge the changes occurring in the cowherd, but we must remember that cows aren’t just cows. Differentiating between conditions in the dairy and beef herds is important since they have significantly different impacts on future beef supplies.
Total cow slaughter so far in 2012 is 4.3% lower than one year ago. That figure flies in the face of the “We’re cutting the herd and there will be far fewer cattle in the future” warning that we and other analysts have been issuing for some time. But that figure and the double-digit, year-on-year declines of the past two weeks must be placed into a longer-run and larger context.
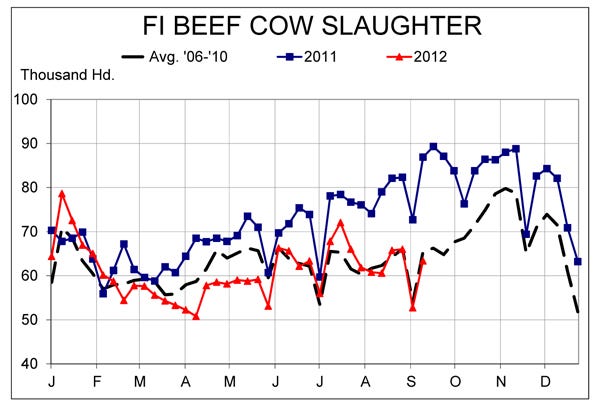
First, we must remember that 2012 beef cow slaughter is always going to look small when compared to 2011 beef cow slaughter. Beginning in summer 2011, weekly beef cow slaughter hit the highest levels it had seen since 1996. Weekly slaughter continued above 80,000 head well into the fall as pasture conditions remained horrible in Texas and Oklahoma. Virtually any data from this year was bound to pale in comparison.
The accompanying chart shows beef cow slaughter rates so far this year have been about equal to their 2006-2010 levels in spite of much wider-spread drought conditions. Part of that is because the beef cowherd is already small. In short, the beef cowherd was cut last year and, even with high costs, isn’t being cut further this year. That still means beef supplies in 2013 and 2014 will be lower.
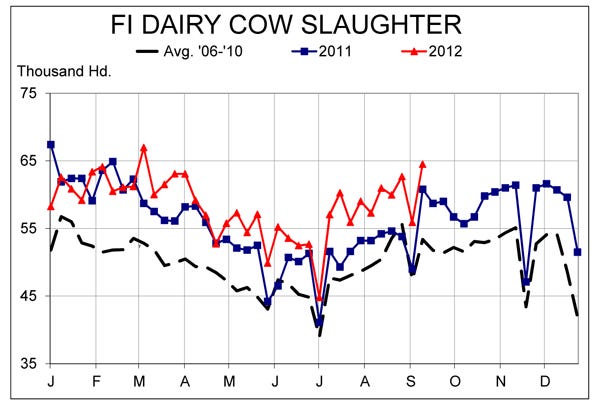
Dairy cow slaughter, on the other hand, has increased steadily relative to 2011 levels since last winter. We’re prone to focus on the sharp increases (+10.8%) since July, but the accompanying chart shows clearly that dairy cow slaughter increased well before the drought of 2012 became obvious.
There were five double-digit, year/year increase weeks between March 1 and July 1. The rise in grain and hay prices as the drought worsened just made the increases more dramatic. Dairy cow slaughter is up 5.8% for the year to date. It was up 6.1% the week of Sept. 14.
Note also the relationship of dairy cow slaughter for both 2011 and 2012 to the 2006-2010 average. It appears that dairy herd turnover has increased, as the herd has remained about the same size (9.104 million in January 2006 vs. 9.150 million in January 2011) while slaughter has increased. That conclusion would be correct but context is important.
The all-time low for the percentage of dairy cows that moved to slaughter was in 2005 at 25%. That figure increased to 25.9% in 2006 and has grown steadily since then. So, while slaughter as a percentage of the total dairy herd is now higher than in 2006, the change is more of a return to “normal” slaughter levels after a sharp decline from 2003 through 2005.
The average percentage of dairy cows slaughtered each year from 1986 to 2003 was 29.4%. The highest annual slaughter rate for dairy cows in our data set was 32.3% in 1986. The rate reached 32.2% in 1996. At its current year-year growth rate of 5.7%, dairy cow slaughter this year could reach 33.4% of the Jan. 1 inventory, a new record high.
It’s very possible that this trend will continue, however, as sexed semen is providing a larger pool of heifers from which to draw replacements. A higher turnover rate would be good for ground beef users, especially considering the lower number of beef cows that will be available for the next few years.
Steve Meyer and Len Steiner, CME Daily Livestock Report
You May Also Like
Enter a zip code to see the weather conditions for a different location.