What’s next in the beef price cycle? Part 2
Depending on what happens in the beef export market, this increased calf crop probably will continue to put pressure on calf prices.
February 8, 2018
My last Market Adviser column reviewed the biological impact of the collective beef cow culling rate and collective beef cow replacement rate as the driving force for cattle cycles. As these two collective rates change at different rates, it causes the national cow herd to increase and decrease through time.
Figure 1 shows the total U.S. cattle inventory from 1957 through 2017. The general long-run trend in all-cattle numbers has been downward for the last 40-plus years. Total beef production, however, has not followed this downward trend over time due to increased animal and carcass size.
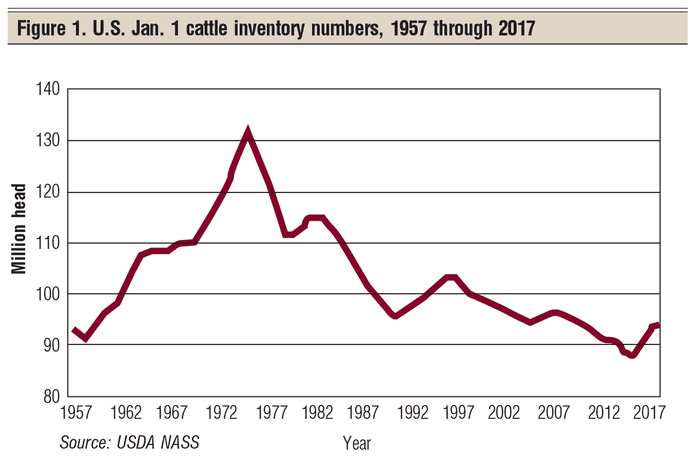
At the same time, there have been short-term ups and downs in overall cattle numbers. These ups and downs are frequently described as cattle cycles.
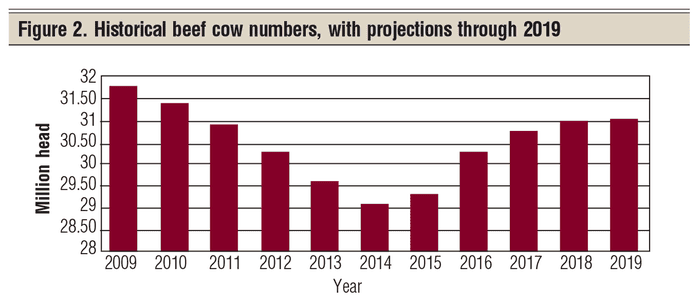
Historically, a typical cattle cycle lasts nine to 11 years. I am suggesting that we are nine years into the current cattle cycle. Projections are for beef cow numbers to grow slowly for two more years, and they may well peak in 2019. This would suggest that the current cycle is an 11-year cycle.
Projections are that the U.S. calf crop, while slowing down, will continue to grow through 2019 (Figure 2). Depending on what happens in the beef export market, this increased calf crop probably will continue to put pressure on calf prices.
Economic performance so far
Let’s take a look at the economic performance of beef cow herds so far in the current cattle cycle. I am going to look at the economic performance of Northern Plains beef cow herds from 2008 through 2016, based on North Dakota’s Farm Business Management herds over that nine-year period. This can serve as the background for projecting the economic performance of beef cow herds through the projected completion of this current cattle cycle in 2019 and into the next cattle cycle.
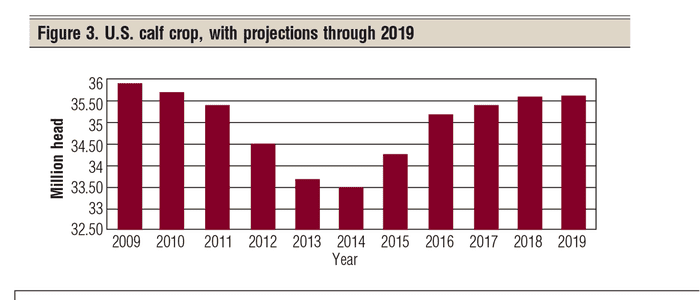
Gross income per cow: As the U.S. calf crop decreased from 2009 through 2014 (Figure 3), calf prices increased and gross income per cow slowly went up (Figure 4). Then in 2014, the low in the U.S. calf crop, calf prices jumped up considerably, generating record gross income per cow in 2014.
This record $1,600 gross income per cow in 2014 generated euphoria in the cattle industry. Now everyone wanted to own beef cows! North Dakota’s Farm Business Management herds sold calves averaging $264 per cwt. in 2014 for a gross income of $1,600 per cow.
The record gross income in 2014 stopped the national reduction in calf numbers and triggered a turnaround and rapid rebuilding of the beef cow herd. By 2016, just two years later, gross income per cow was down to $890 per cow.
Rapid price changes are not necessarily good. Markets tend to overreact in both directions. My analysis suggests that calf prices were $40 per cwt too high in 2014, which led to calf prices being $40 too low in 2016.
Then in 2017, we saw calf prices swing back up to $167 per cwt at weaning time. Rapid price swings make business planning difficult at best and can cause havoc in anyone’s beef cow business plan.
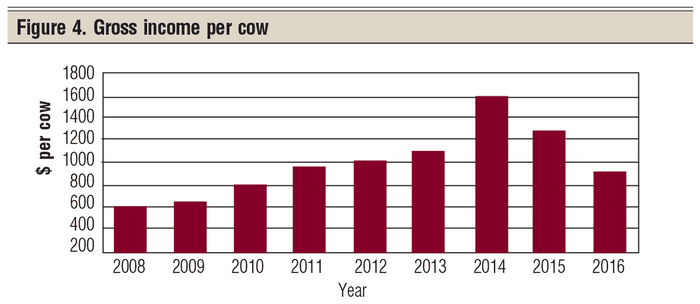
Let’s take a look at beef cow gross income per cow for the nine-year period from 2008 through 2016. Calf prices started an upward trend in 2009 and slowly marched upward from 2010 through 2014 — the first five years of this cattle cycle as the U.S. calf crop was going down.
Years 2013, 2014 and 2015 were the high gross income years. These favorable years triggered a regrowth in the U.S. calf crop. Once set in motion, the U.S. calf crop is projected to continue expanding through 2019.
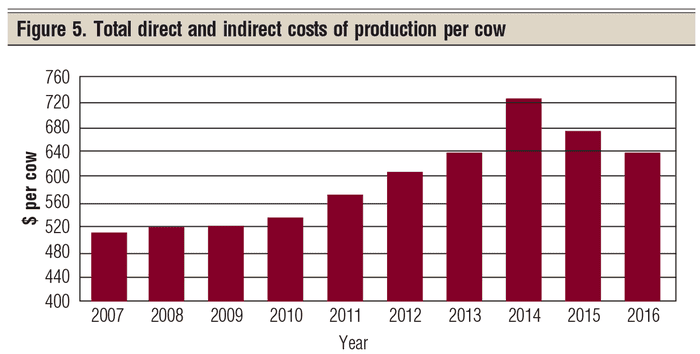
Costs of production: Figure 5 presents the total direct and indirect costs of production (excluding labor and management) for these Northern Plains beef cow herds during the current cattle cycle. While feed costs are generally not tied to national cattle numbers, feed costs per cow are trending upward through time and account for a significant part of the cost increases in Figure 5. Pasture costs were a significant part of this cost increase.
Cost of replacement animals in the herd: Figure 6 presents the total value of purchased animals and animals transferred into the beef cow herd (replacement females and bulls purchased). This is the second major increasing production cost during this cattle cycle.
Remember, a raised replacement heifer has two economic costs involved. First is the opportunity cost of not selling the heifer calf at weaning time. Second is the cost to develop that weaned heifer from weaning through preg-check, when she is placed in the breeding herd as a preg-checked female.
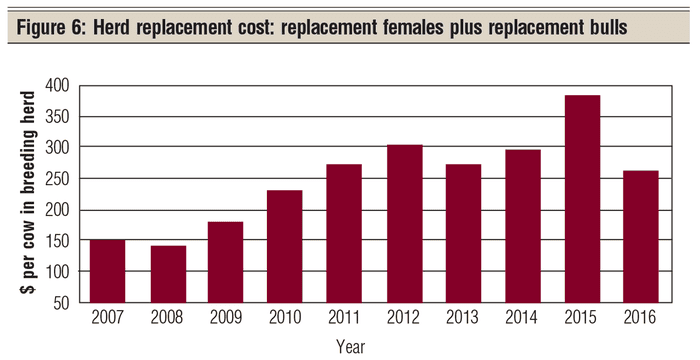
Note the highest-priced heifer put into the herd was a 2014-born heifer, developed and preg-checked in fall 2015. That high-priced replacement heifer is going to be in the herd potentially from 2016 through 2022 —during the low prices of the rest of this cattle cycle, and potentially the low prices in the beginning of the next cattle cycle. This is a high-cost heifer producing calves during the low-price part of the price cycle.
I predict we will see some newly formed (2015-16) beef cow herds disappear over the next few years due to the high investment cost of starting and expanding herds in 2015-16 with high-cost breeding animals — often financed with borrowed money.
A contrarian replacement strategy: Each January, USDA publishes the Jan. 1 Cattle inventory report and indicates if the national herd is expanding or contracting. Over the years, I have argued that the best place to make the cattle cycle work for you is through your herd’s replacement rate.
A contrarian policy could have significant economic rewards. You increase your individual replacement rate when the national herd is contracting, and you contract your herd’s replacement rate when the national herd is expanding. Thus, a contrarian policy.
In addition, try to have your highest number of 4- to 6-year-old females (your peak producers) during the top of the beef price cycle.
Nine to 11-year cattle cycles and a productive life of seven calves or so from a female can generate some challenging, but rewarding business opportunities.
Hughes is a North Dakota State University professor emeritus. He lives in Kuna, Idaho. Reach him at 701-238-9607 or [email protected]
About the Author(s)
You May Also Like
