Subscribe to Our Newsletters
BEEF Magazine is the source for beef production, management and market news.
Continued tight stocks are magnifying the seasonal market volatility that goes part and parcel with the heart of the corn-growing season. Between July 1 and July 22, nearby September corn futures traded in a window of about a $1.
July 24, 2011

Continued tight stocks are magnifying the seasonal market volatility that goes part and parcel with the heart of the corn-growing season. Between July 1 and July 22, nearby September corn futures traded in a window of about a $1.
Though the World Agriculture Supply and Demand Estimates (WASDE) report released earlier this month pegged corn acreage and ending corn stocks higher, the market didn't believe it. Even if traders did, the upward revisions still came in below what the trade was expecting.
At the time, economists with the American Farm Bureau Federation (AFBF) stressed that corn supplies are still very tight and a big crop is needed to meet strong demand and build reserves to a more comfortable level.
Even with the upward revisions, Todd Davis, AFBF crops economist explained "…Our supply situation is still very tight. In June, USDA showed a stocks-to-use ratio of 5%, which is just 19 days of supply. USDA raised its stocks-to-use ratio to 6%, which is still only 24 days of supply."
"In the U.S., we've typically had more grain and soybeans than we could use here… Now, we have to ask ourselves, can the U.S. and the other major suppliers meet all these world demands?" says Chris Hurt, Purdue University ag economist.
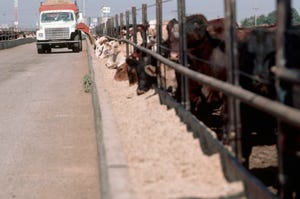
For instance, corn use for ethanol represented 27% of crop usage in 2010-2011, compared with 10% of the 2005-2006 crop. Growing demand for corn to make ethanol, and China's increasing desire for soybeans, represent two big demand shocks for agriculture.
"When you put them on top of each other, the price impacts are a lot bigger than either one separately," Hurt says. He and fellow Purdue ag economists Phil Abbott and Wally Tyner released a report last week entitled "What's Driving Food Prices in 2011." In it they explain growing demand for corn to use in biofuels and growing demand for soybeans to help feed a booming Chinese economy are among key forces driving commodity prices higher this year. They explain a weak U.S. dollar, high oil prices, declining grain supplies and poor harvests in 2010 also contributed.
The report was commissioned by Farm Foundation, NFP and follows previous analyses conducted for that same organization when retail food prices also peaked in 2008 and 2009.
The report points out that the amount of U.S. farmland needed to meet those two surging demands has increased from 16.1 million acres in 2005 to 45.6 million acres in 2010, an increase of 189%.
U.S. agriculture met these demands in two ways, say the economists:
First, U.S. farmers shifted land into producing corn and soybeans and out of other crops such as cotton, wheat and sorghum. As a result, prices for most other crops also rose.
Second, U.S. stocks were used to the point where there is now a minimum inventory of grains to meet any production shortage. As a result, any weather threats to normal yields in 2011 will mean higher prices.
Abbott explains that China's rapid economic growth is resulting in more demand as their consumers both buy more food and shift their food mix toward more animal products such as meat, milk and eggs, which require corn and soybeans to produce.
However, Abbot adds, "We also found that about 40% of the increase in Chinese soybean imports in recent years was due to increasing their inventories or building stocks. We believe they now have sufficient stocks levels, and that could slow their overall rate of growth of purchases in coming years."
Moreover, Abbott explains, "The movement of agriculture into biofuels has now linked the oil market to the corn market and to ag markets in general. If oil is high-priced, this will tend to mean agricultural markets are high-priced as well. All of that is contributing to higher commodity prices in general."
The economists also note that agricultural markets have become less responsive to price changes, leading to both high prices and greater volatility in prices. As you know, most of the U.S. corn used for ethanol is mandated by the government. The mandate requires that 12.6 billion gals. be blended into gasoline in 2011. It will increase to 15 billion by 2015.
That mandate creates an inelastic market. According to the Purdue economists, "Other inflexibilities are coming from foreign buyers who want basic food commodities, almost regardless of price, and from the livestock sector, which now can afford to pay much higher prices for feed than just a few years ago."
Looking to the future, they say a slowing rate of growth in both corn use for ethanol and in soybean purchases by China could provide a better chance for world grain supplies to catch up to slowing demand surges. But, Hurt says it's unlikely we'll go back to having huge surpluses because that demand base remains so strong.
For the week ending July 17, according to the National Agricultural Statistics Service:
Corn – 35% is silking, 27% less than last year and 12% less than average. 66% is in Good or Excellent condition, compared to 72% a year ago. 11% is rated Poor or Very Poor, compared to 9% a year ago.
Soybeans – 40% is blooming, 18% less than last year and 12% less than average. 64% is in Good or Excellent condition; 67% was last year.
Sorghum – 31% is headed, compared to 28% last year and 31% for average. 25% is coloring, 7% more than last year and 4% more than the average. 31% is in Good or Excellent condition; 75% was last year.
Winter wheat – 68% has been harvested, which is 2% less than last year and 4% less than average.
Spring wheat – 60% is headed, which is 24% behind last year and 28% behind the five-year average. 73% is in Good or Excellent condition, compared to 82% a year ago.
Oats – 89% is headed, 9% behind last year and the average. 13% has harvested, compared to 19% last year and 16% for average. 59% is reported in Good or Excellent condition; 78% was at the same time a year ago.
Barley – 62% is headed, which is 17% behind last year and 21% behind normal. 76% is in Good or Excellent condition, compared to 86% last year.
Pasture – 46% of the nation’s pasture and range is rated as Good or Excellent, 18% less than at the same time last year. 32% is rated Poor or Very Poor, compared to 11% a year ago. States reporting more than 40% of pasture as Poor or Very Poor were: Arizona (66%); Arkansas (59%); Colorado (41%); Kansas (44%); Louisiana (48%); Mississippi (46%); New Mexico (90%); Oklahoma (78%); Pennsylvania (43%); South Carolina (48%); and Texas (94%).
You May Also Like
Enter a zip code to see the weather conditions for a different location.