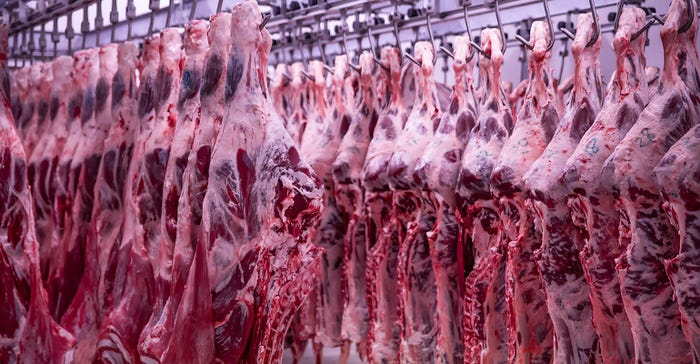
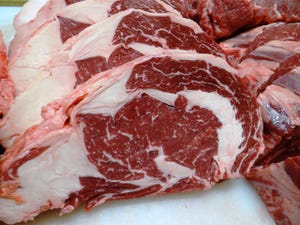
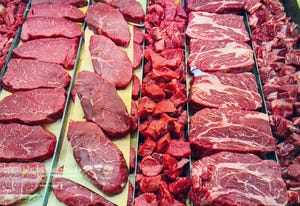
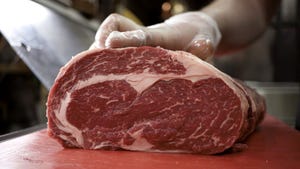
This September marks the start of BEEF magazine’s 50th year of publication. Over the past 50 years, BEEF has grown to play a major role in technology transfer for the U.S. beef industry and beyond. I’m proud to have been a part of that effort for the last 12 years.
In 1963, I was working on my master’s degree in farm management at the University of Nebraska. My research involved a large regional project requiring me to build a computerized farm-level model designed to calculate the “most profitable farm organization” for nine different types of farms in eastern Nebraska.
I spent a lot of evenings in the university’s computer center that year, learning how to run my first computer. Computers have been an integral part of my ranch management educational programs ever since.
In 1963, the U.S. corn price averaged $1.11/bu., hay price averaged $25/ton, and slaughter steers averaged $23.60/cwt. I calculate that the steer-corn price ratio was 21 at that time, which means 100 lbs. (cwt.) of steer was equal in value to 21 bu. of corn. I also calculate that retail beef was 90¢/lb. in 1963, and the farm value of retail beef was 68¢/lb.
Let’s review the last 50 years by examining a few economic indicators in five representative years of roughly 10-year increments: 1963, 1974, 1983, 1993 and 2012. A review of this data shows an interesting economic pattern.
Figure 1 summarizes 50 years of corn prices. In 1963, corn price averaged $1.11/bu., but it almost tripled to $3.02/bu. by 1974, and government programs kept corn prices in the $2 to $3 range until 2006, when the ethanol era began. In 2012, corn averaged $6.22/bu., driven up by ethanol subsidies and the 2012 drought. That’s a 560% increase in corn price in 50 years; however, most of the increase occurred in the last six years.
Figure 2 summarizes historical hay prices. The average hay price in 1963 was $25/ton. That increased to $80 by 1983, hovering in that range through 2003. The ethanol era, which began in 2006, prompted a lot of hay land to be planted in corn. Then, the added pressure exerted by the 2012 drought drove the hay price to a $191/ton average in 2012. This is an 876% increase in 50 years; again, most of the increase was in the last few years.
Figure 3 depicts historical steer prices. In 1963, it averaged $23.60/cwt., generally trending upward each representative year, except in 1993. This is a 521% increase in steer prices over a 50-year period, or a calculated average trend line increase of $1.78/year.
Meanwhile, the steer-corn price ratio in Figure 4 compares corn prices to steer prices. The historical steer-corn ratio increased for 40 years, which indicates that the price of a cwt. of steer was equal in value to more and more bushels of corn. However, in the last six years, it’s dropped substantially. In 2012, it was down to 20.
Figure 5 summarizes historical retail beef price. I estimate the 1963 average retail beef price was 97¢/lb., which grew steadily to $5.01 in 2012. This is a 516% increase over the 50-year period, with a calculated trend value increase of 8.8¢/lb./year.
I estimate the net farm value of retail beef was 68¢/lb. in 1963. This value increased to $2.43 in 2012 — a 412% increase over 50 years (Figure 6). My calculated trend value for the net farm value of retail beef is a positive 3.2¢/lb./year.
Meanwhile, the farm share of the beef retail dollar (Figure 7) has trended down a total of 21% in the last 50 years. This suggests that beyond the farm gate, processing costs, marketing costs, and wholesale and retail profits associated with retail beef steadily increased through time. (Non-farm labor costs and transportation costs are examples of these ever increasing non-farm costs.) I fully expect these non-farm costs to keep increasing with time, suggesting continued decreasing farm share.
Now, let’s look at North Dakota Farm Business Management’s annual record summaries to examine beef cow profits over the last 50 years. I had to extrapolate the numbers for 1963 as I could only obtain data back to 1974.
Figure 8 summarizes the annual total feed costs for these herds for the representative years. Feed costs were fairly stable the first 30 years, but accelerated upward in the last 20. Clearly, 2012 was a year of record feed costs.
Total beef cow production costs (minus replacement costs) are presented in Figure 9. Generally, production cost trended up through time. The one exception was in 1993, when costs leveled off. Total costs reached a 50-year high in 2012. The 50-year trend in per-cow costs was $7.70/year.
Figure 10 presents the earned net income summary for these Northern Plains herds. I could not generate a figure for 1963, but earned net income for the mid-1970s was generally negative. This was a time of record cattle numbers in the U.S.: 132 million head. Earned net income for these representative years was the highest in 1993, and again in 2012.
The earned net income data indicate that times were tough in the mid-1970s for these Northern Plains herds, so-so in the 1980s, and good in the mid ’90s and 2011-2012 eras. In fact, the average annual earned net income the last 20 years is $86/cow.
Figure 11 summarizes the change in selected economic indicators over this 50-year period. Corn and hay increased the highest percentage, while retail beef price is third, followed by the farm value of retail beef.
The bottom line is that economics have begun to shift beef cow production from areas of high cattle feed costs to regions of lower feed costs (grazing). This suggests to me that beef cow production will continue to shift out of the Corn Belt into other grazing regions of the nation. These data also suggest that producers in the Northern Plains face a challenging cost structure, given the current trend for the farm value of retail beef price.
Harlan Hughes is a North Dakota State University professor emeritus. He lives in Kuna, ID. Reach him at 701-238-9607 or [email protected]
You might also like:
If Nature Cooperates, Good Times Are Ahead For Beef Producers
Forecasting The Cattle Market For The Rest Of The Decade
Nutrient Values For 300 Cattle Feeds