Farm Business Management
More Topics
Farm Progress America, April 25, 2024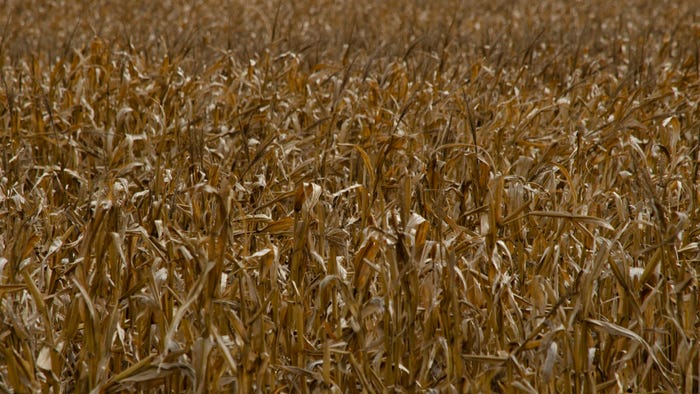
Farm Business ManagementFarm Progress America, April 25, 2024Farm Progress America, April 25, 2024
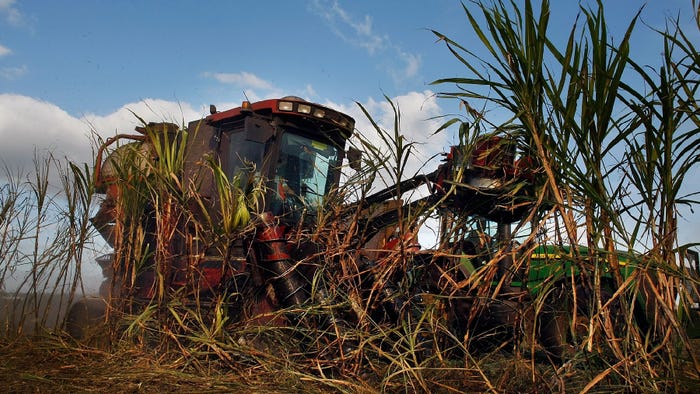
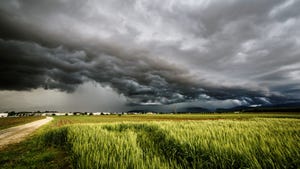
Mike Pearson takes a look at the #harvest24 in South America, primarily Argentina and what it has brought producers there.


.jpg?width=300&auto=webp&quality=80&disable=upscale)


.png?width=300&auto=webp&quality=80&disable=upscale)
.png?width=300&auto=webp&quality=80&disable=upscale)


Recent Headlines


Enter a zip code to see the weather conditions for a different location.

Aug 27 - Aug 29, 2024
Aug 27 - Aug 29, 2024
Farm Progress Show annually hosts more than 600 exhibitors displaying new farm equipment, tractors, combines and farm implements; seed and crop protection products; and many additional farm supplies and services.
LEARN MORESubscribe to Our Newsletters
BEEF Magazine is the source for beef production, management and market news.