Farm Business Management
More Topics
thumbnail
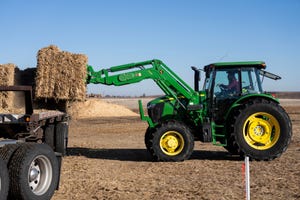
PolicyFDA finalizes guidance to provide further clarity on Veterinary Feed DirectivesFDA finalizes guidance to provide further clarity on Veterinary Feed Directives
The FDA has issued finalized guidance (GFI #120) to assist stakeholders involved with veterinary feed directives in complying with the Veterinary Feed Directive final rule published in 2015.
.png?width=700&auto=webp&quality=80&disable=upscale)


.jpg?width=300&auto=webp&quality=80&disable=upscale)


.png?width=300&auto=webp&quality=80&disable=upscale)
.png?width=300&auto=webp&quality=80&disable=upscale)


Recent Headlines

.png?width=300&auto=webp&quality=80&disable=upscale)

Enter a zip code to see the weather conditions for a different location.

Aug 27 - Aug 29, 2024
Aug 27 - Aug 29, 2024
Farm Progress Show annually hosts more than 600 exhibitors displaying new farm equipment, tractors, combines and farm implements; seed and crop protection products; and many additional farm supplies and services.
LEARN MORESubscribe to Our Newsletters
BEEF Magazine is the source for beef production, management and market news.