Farm Business Management
More Topics
thumbnail
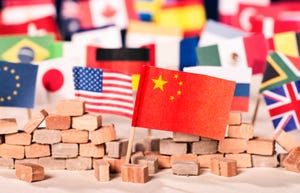
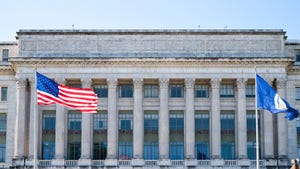
PolicyCanadian cabinet minister to visit UNL to discuss trade, geopoliticsCanadian cabinet minister to visit UNL to discuss trade, geopolitics
Canada’s minister of innovation, science and industry, will deliver an address speaking on “U.S.-Canada Trade and Geopolitics."
.jpg?width=300&auto=webp&quality=80&disable=upscale)


.png?width=300&auto=webp&quality=80&disable=upscale)
.png?width=300&auto=webp&quality=80&disable=upscale)


Recent Headlines


Enter a zip code to see the weather conditions for a different location.

Aug 27 - Aug 29, 2024
Aug 27 - Aug 29, 2024
Farm Progress Show annually hosts more than 600 exhibitors displaying new farm equipment, tractors, combines and farm implements; seed and crop protection products; and many additional farm supplies and services.
LEARN MORESubscribe to Our Newsletters
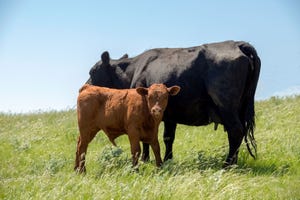
BEEF Magazine is the source for beef production, management and market news.