Taking stock: Exploring U.S. cow herd composition
Cow herd genetic concentration continues to mature according to exclusive BEEF survey exploring the genetic makeup of the industry.
January 2, 2020
Commercial cow-calf producers responding to BEEF’s exclusive genetics survey offer a snapshot that’s likely in keeping with prevalent views about genetic composition of the nation’s cow herd, as well as expectations when it comes to buying bulls. However, some will also find a few surprises along the way.
BEEF conducted the survey to provide commercial producers a glimpse of their peers’ herds and genetic intentions, and seedstock producers a broad third-party view. It also provides comparison to the genetic offering provided by this year’s Seedstock 100.
For perspective, BEEF expanded demographics to include commercial producers with fewer than 100 cows in their inventory. The survey was conducted in September and October this year.
All told, 55% of responses came from operations with 99 or fewer cows, 36% with 100-499 and 9% with more than 500 cows.
Respondents came from 37 states, but 44% of responses came from just seven: Texas (11%), Missouri (7%), Nebraska (6%), and then 5% each for Iowa, Kansas, Montana and Oklahoma. That closely mirrors the states with the most cows in the nation’s inventory. Seventy-five percent of the responses came from producers 55 years of age or older; 43% from those 65 or older.
A note of caution: Interpretation of what follows is based on responses from this specific survey.
Cow herd composition today
Perhaps the most definitive take-away from the survey, though expected, is confirmation of the breadth and depth of breed concentration.
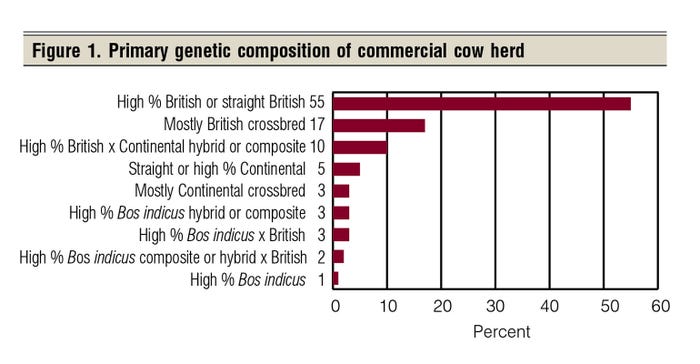
In general terms, 72% classified the predominant makeup of their cow herds as either straight or high-percentage British (55%) or mostly British crossbred (17%). See Figure 1.
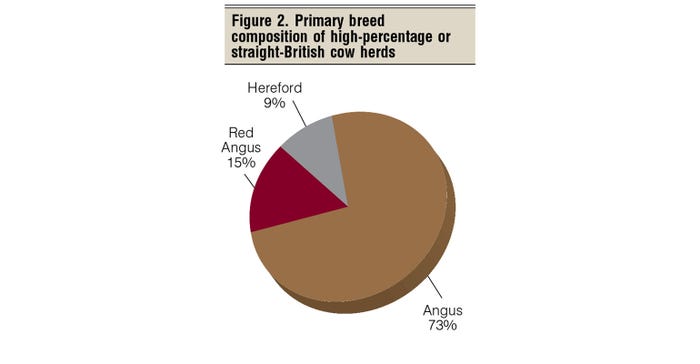
In Figure 2, of those with straight or high-percentage British, 88% described the predominant breed composition of their herds as Angus (73%), Red Angus (15%) or Hereford (9%).
Another 10% of respondents described their herds as high-percentage British x Continental hybrid or composite. The composition of herds in this group include breeds such as Sim-Angus (62%) or Balancer (26%), as Figure 3 shows.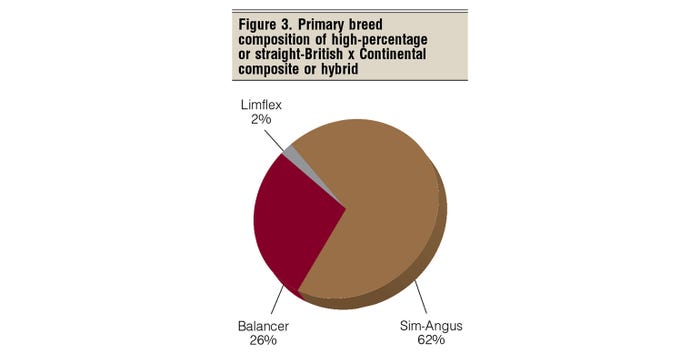
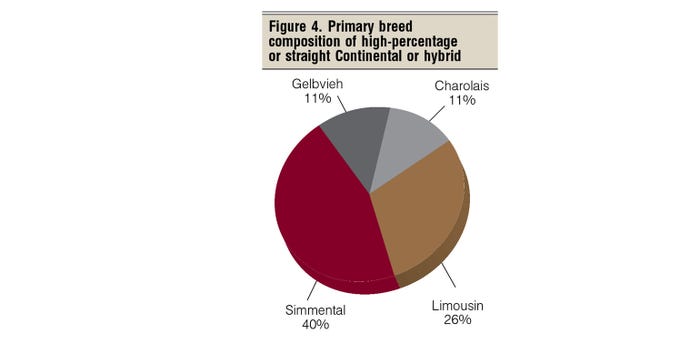
However, Continental breeds still play a role (Figure 4). Of those responding to the survey, 5% say their herds are of straight or high-percentage Continental breeding. This includes Simmental (40%), Limousin (26%), Charolais (11%) or Gelbvieh (11%). Another 3% say their herds are primarily Continental crossbred.
There were 3% of respondent herds comprised of high-percentage Bos indicus composite genetics, with 35% saying Beefmaster was the primary breed.
Likewise, 3% of respondent herds were made up of mostly Bos indicus x British genetics, including Brangus (35%).
Similar breed predominance also can be seen in current and expected bull selection, with 84% of respondents saying the breed makeup of bulls purchased most recently was Angus (55%), Hereford (16%) or Red Angus (13%). Simmental came in at 9%, followed by Sim-Angus (8%), Balancer (5%), Charolais (4%) and Brangus (4%). At least 1% of respondents cited nine other breeds, hybrids or composites.
That coincides with the supply of bulls offered by BEEF Seedstock 100 producers. The most commonly offered breeds are Angus, Red Angus, Hereford, Charolais and Sim-Angus. Overall, those operations offered 33 different breeds, composites or hybrids.
What’s more, only 22% of respondents say they plan to change the breed composition of their cow herd in the next five years. Of those, 54% plan to increase the percentage of British genetics, 44% plan to increase the percentage of Continental and 11% plan to increase the percentage of Bos indicus.
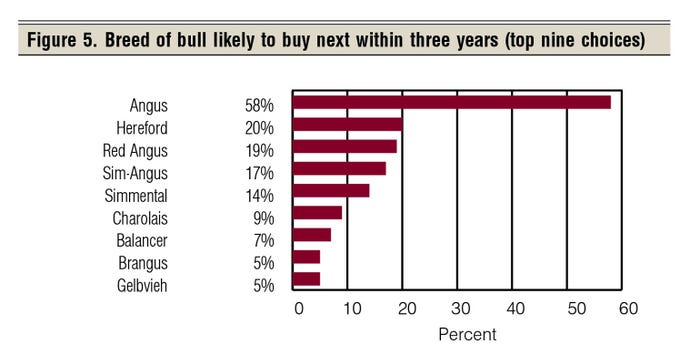
Likewise, respondents say the breed composition of the bulls they buy in the next three years will likely be Angus (58%), Hereford (20%) or Red Angus (19%). Next come Sim-Angus (17%), Simmental (14%), Charolais (9%), Balancer (7%), Brangus (5%) and Gelbvieh (5%). At least 1% of respondents cited 11 other breeds, hybrids or composites (see Figure 5).
According to the BEEF survey, 79% of the bulls used by respondents are purchased, 18% are raised and 3% are leased.
Overview of respondents
As expected, the majority of those responding (48%) have spring-calving herds, but 41% say they have both spring-calving and fall-calving herds. The other 12% report only a fall-calving herd.
As for the length of the calving season, it’s 45 days or less for 25% of the respondents, 46 to 90 days for 57% and 91 to 135 days for 11%.
Most (85%) raise their own replacements. As well, 14% market some of their calves as breeding stock.
Live auctions continue to be the most widely preferred way to market calves, with 68% of respondents saying they market that way: postweaning (27%), as weaned calves (23%) or straight off the cow (18%). Another 25% market calves directly, and 9% via video auction.
Furthermore, 18% say they retain ownership in their calves through the feedlot. There is no prior-year data for direct comparison, but that’s more than indicated by other industry measures over time. If so, logic suggests a growing number of cow-calf producers recognize the value of their genetics, and the opportunity to capture more of the value through longer ownership.
Folks in the retained ownership camp likely are also among the 32% of respondents who say they’re involved in value-based marketing. Preconditioning (77%) and source verification (53%) lead the value-added management and verification- provided.
That’s followed by verified genetics (39%), humanely raised (37%), non-hormone-treated (34%), natural (29%), antibiotic-free (27%), verified persistently infected and bovine virus diarrhea-negative (PI-BVD) (14%), grass-fed (13%) and organic (2%).
Moreover, 18% say they changed the breed of bulls purchased in the last five years in order to participate in a specific value-added program; 22% changed seedstock suppliers to do so.
Required data, documentation
Although impossible to confirm with a single survey, responses suggest that in some cases, the brand of bulls purchased is more important than breed or pedigree. Only 35% say they require a breed association registration paper, while 48% demand to know the pedigree.
That’s still a step short of the longtime pig genetics model, but it bears consideration by breed associations relative to their role today and in the future.
Predictors of calving ease and weaning weight performance continue to be information most bull buyers want.
With calving ease in mind, 78% of respondents require knowing the actual birth weight, 71% want a birth-weight EPD, 77% want the EPD for calving ease-direct and 52% want the EPD for calving ease-maternal.
As for growth up to weaning, 63% want the actual weaning weight, 55% the adjusted weaning weight and 62% demand a weaning-weight EPD.
Next on the list, which some will find surprising, is that respondents place indicators of disposition ahead of yearling weight performance.
Fifty-four percent of respondents say they require a disposition score and 59% want a disposition EPD. When it comes to yearling weight, 51% want the actual weight, 46% want the adjusted yearling weight and 53% want the yearling-weight EPD.
As for maternal potential, 50% of respondents require an EPD for milking ability, while 40% want an indicator of reproductive efficiency, such as an EPD for heifer pregnancy or stayability.
Incidentally, 54% want the actual yearling scrotal measurement, while 29% want the yearling adjusted scrotal measurement and 35% want a scrotal EPD.
Carcass data and carcass EPDs trail on the list of information buyers require to buy bulls, along with measures of potential feed efficiency.
AI use continues to grow
This also applies to AI sires. Although still a minority, 47% of respondents say they use artificial insemination. Of those, 69% use it on both heifers and mature cows, 23% on heifers and 9% on mature cows.
In fact, 49% say they AI 61% or more of their cows and heifers. Most (58%) use fixed-time AI, while 42% heat-detect.
Among other documentation, respondents say they require a breeding soundness examination (59%), PI-BVD test (27%) and genomic profile (25%).
Speaking of which, 46% of respondents say they use genomic data in selecting bulls. The survey question made no distinction between genomic profiles of individual animals and DNA data used in calculating genomic-enhanced EPDs. If the latter was considered, logic suggests the percentage would be higher.
Either way, the idea that about half of bull buyers use genomic data in selection would have been unthinkable just a few years ago.
Just 13% of respondents say they use stand-alone genomic tests in selecting replacement heifers.
Overall, 82% of respondents say the information they receive from seedstock suppliers is understandable. Fourteen percent say it’s too complicated.
Selection indexes are supposed to make sorting and selection easier, if an index is available that serves the specific purposes of unique buyers. According to the survey, 56% of respondents routinely use selection indexes to identify bull candidates.
In order to buy a bull, 44% of respondents want a selection index for maternal ability, 39% want one for end-product value and 31% want a multipurpose index.
About the Author(s)
You May Also Like


.png?width=300&auto=webp&quality=80&disable=upscale)
