2016 benchmarks for beef cows — Part 2
Benchmarking can be a very powerful herd management tool. Here's a look at 2016 numbers you can compare your herd to.
August 30, 2017
Last month I began a two-part discussion on production and economic benchmarks for beef cow herds. This month, we’ll go into more detail on how I calculate these benchmarks, with the hope that you will take the time to compare your herd’s numbers with these benchmarks. Benchmarking can be a very powerful herd management tool.
Last month I reported the benchmark gross income number for Northern Plains beef cow herds was $894 per cow. Let’s take a detailed look at how this income number was derived.
North Dakota’s Farm Business Management System uses a gross margin approach, and I use an adjusted gross income approach to document the income side of the beef cow herd. The calculated final bottom line of these two approaches turns out to be the same.
Figure 1 presents both income approaches, so let’s study both — and then you can choose the one that you prefer.
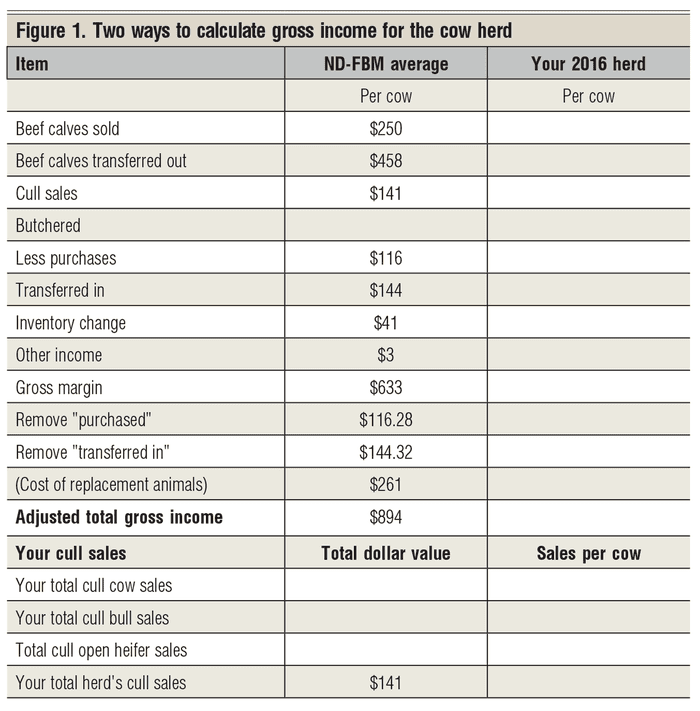
These costs are labeled animals purchased and animals transferred in. The final number is labeled gross margin and it equaled $633 per cow in 2016 for these benchmark herds.
I prefer treating the purchased animals and transferred in as production costs, with both added together and labeled as replacement costs, including bull purchases. As a result, the adjusted total gross income for these benchmark herds comes to $894 per cow. This number is the gross income for the beef cow herd. Subtract the inventory change and you have the cash income of $853 per cow.
The bottom part of Figure 1 is included to help you construct your total cull sales for the beef cow enterprise. Cull sales for these benchmark herds totaled $141 per cow.
Ranchers all feed their cows differently. For comparative purposes, I like to convert each rancher’s winter feeding program to tons of hay equivalent.
This, then, allows me to more easily compare one feeding program with another.
Figure 2 shows the average total winter forages fed to these benchmark herds, all converted to tons of hay equivalent. The average total winter dry matter consumed by these benchmark herds figured out to 5,631 pounds per cow.
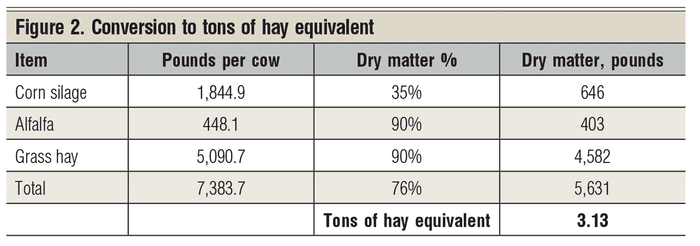
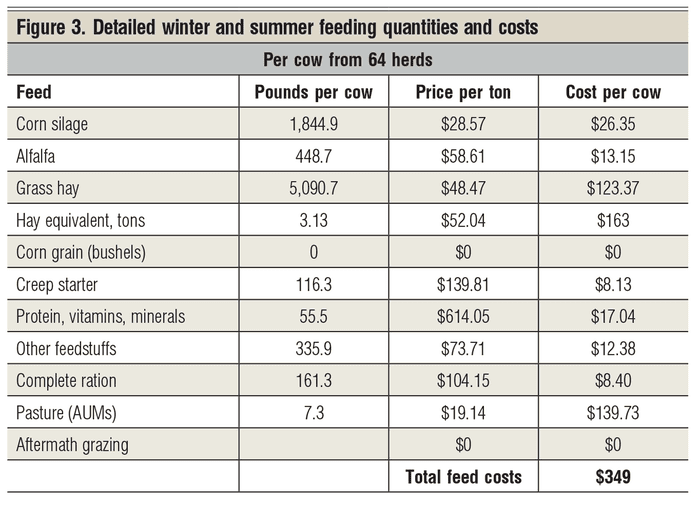
Figure 3 shows the average feeds fed by the 64 different herds included in this benchmark analysis. As you would suspect, all kinds of different feeds were fed.
These benchmark herds consumed, on average, 3.13 tons of hay per cow. From a grazing standpoint, Figure 3 shows that the summer grazing program averaged 7.3 AUMs (animal unit months) of grazing per cow. Protein and vitamins averaged $17 per cow per year.
A more common denominator for feed comparison is to convert all feed consumption to an economic cost. This is done in Figure 3. As reported in last month’s article, winter feed costs averaged $209 per cow and summer feed costs averaged $109 per cow, for an average annual cost of $349 per cow for the year.
Let’s put all of these benchmark numbers into one final summary for these Northern Plains beef cow herds. The primary product of a commercial beef cow herd is the pounds of calf sold. Since we market calves on a price per hundredweight (cwt) of calf, I encourage ranchers to calculate their costs of producing a cwt of calf. This number tells you a lot about the production and economics of your beef cow herd.
The problem is that a beef cow enterprise produces five different products — steer calves, heifer calves, cull cows, cull bulls and cull replacement heifers.
What costs go to what product? I do not know.
Here is how I combine all of these incomes into one primary production measure. I take the total income per cow from all of these income sources, i.e., the $894 average income per cow for these benchmark herds, and divide that gross income by the price of steer calves sold ($136 per cwt) for these benchmark herds.
This gives me a total gross income per cow equivalent to 6.57 cwt of steer calves. So, after adjusting for all five incomes, it is equivalent to selling 657 pounds of steer calf per cow. Selling 657 pounds of steer calves at $1.36 per pound equals $894 gross income per cow.
All production costs per cow are then divided by the 6.57 cwt of steer equivalents to get the production costs per cwt. For example, the $834 production cost per cow divided by 6.57 suggests a cost of producing a hundredweight of calf at $127.
A little further down in Figure 4, I indicate that it costs 93 cents to produce a dollar of income from these benchmark herds. This implies an economic return of only 7 cents per dollar spent on the beef cow herd earned by the family’s resources —unpaid family labor, management and equity capital.
So, my challenge to you is: Did your herd beat this $127 cost of producing a hundredweight of calf? If so, pat yourself on the back.
If not, where are your costs higher than these benchmark herds? Can you change something to lower these costs to beat these benchmark herds in 2017? How about in 2018?
I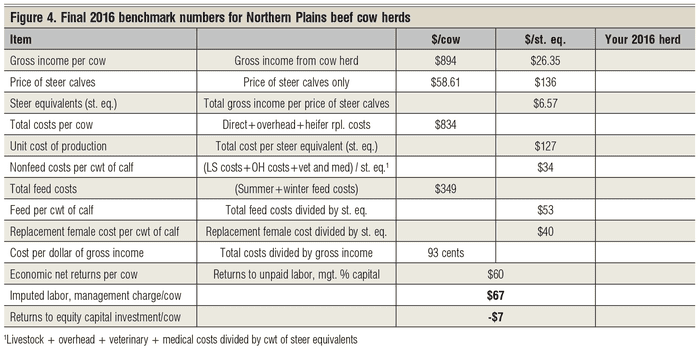
Then, use benchmarking to identify your herd’s production weaknesses, and focus on them one at a time. It may take a whole year, or even more, to remove one weakness.
But, as you remove a weakness, profit should go up. Measure that benchmark factor next year, and see if it now equals or beats the benchmark herds.
After that weakness is removed, select another weakness and remove it. Over time, the profit for the herd goes up and up.
All benchmarking does is help you know where to focus your management attention — and that’s important, especially at this point in the cattle cycle.
Hughes is a North Dakota State University professor emeritus. He lives in Kuna, Idaho. Reach him by calling 701-238-9607 or by emailing him at [email protected].
About the Author(s)
You May Also Like


.png?width=300&auto=webp&quality=80&disable=upscale)
