How do you compare to other ranchers?
When you start a beef cow herd is critical. Here's a look at the numbers of how you compare to the average rancher.
June 28, 2018
In the 1980s and 1990s, I’d tell cattle producers that the most important factor to having a profitable beef cow herd was determined by the year that they started their beef cow herds. If they started a herd on the upward portion of the beef price cycle, they probably made it in the beef cow business.
If they started a herd on the downward side of the beef price cycle, the odds were against them.
I still think there is a lot of truth to these statements yet today. Unfortunately, when you start a beef cow herd is critical.
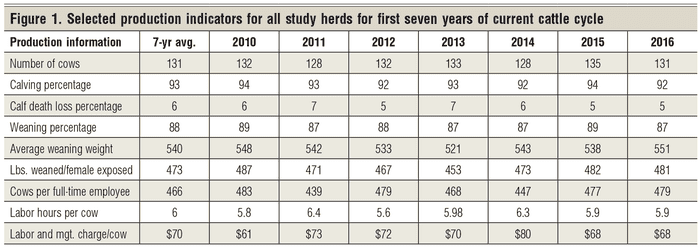
Let’s study herds in four states over the first seven years of the current cattle cycle. My data source is the University of Minnesota’s FINBIN data (from North Dakota, Nebraska, Minnesota and Utah). Farm business management data was collected on 1,766 herds over the seven-year period of the current cattle cycle (2010 through 2016). New herds were added and other herds dropped out over this seven-year period. Each column in Figure 1 is the average of those herds that were in the database for that year.
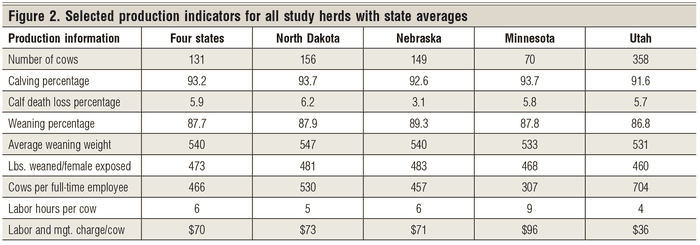
The seven-year average number of cows in a herd in the four states was 131 cows; the average herd size varied considerably. Minnesota had the smallest average-sized herds of 70 cows per herd. Utah had the largest, with 358 as the average number of cows in a herd. North Dakota’s average herd size was 156 cows, and the Nebraska herd average was 149 cows.
These herd sizes are not meant to be representative of these respective states — they are just the average herd sizes of the ranchers participating in each state’s Farm Business Management Extension Program.
Further study of the individual state data did not reveal any trend upward or downward in herd sizes through these seven years. This adds support to my general belief that cattlemen generally do not change herd sizes in response to the cattle cycle. Should they? This will be a subject of a future Market Advisor.
Looking at the data
There are numerous factors to consider when evaluating trends.
Calving percentages: The seven-year average calving percentage for all herds was 93.2% and tended to be in the low 90s each year. Each of the four states also averaged in the low 90s for the seven-year period.
Calf death loss: This is a measure of the portion of the live calves born that are lost from birth to weaning. The four-state average was 5.9%. The variation in the four-state averages was very small.
Weaning percentage: The four-state average weaning percentage over seven years was 87.7%. Once again, there was very little variation from state-to-state averages.
Average weaning weight: The seven-year average weaning weight for the four states was 540 pounds. I would expect some variation in average weaning weights by state due to considerably different production environments. Surprisingly, at least to me, there was only a 17-pound difference in the seven-year averages from lowest to highest of the four states.
Pounds weaned per female exposed: I prefer this measure of herd production as I found that it correlated the best with profits in my past integrated resource management (IRM) herd studies. Be careful, and be sure that you use “females exposed” and not “females left after culling open cows,” as often happens.
Again, I would expect some environmental effect among these four regions, and there was (Figure 2). Years 2012, 2013 and 2014 were the lowest years, and I have no explanation.
Labor hours per cow: In general, I always suggest that beef cows do not take a lot of labor per cow. The data support this in that the seven-year average of the four states was six hours per cow.
Again, this varies considerably by state and herd size. North Dakota and Nebraska herds over this seven-year period averaged five hours per cow. Minnesota’s smaller-sized herds averaged nine hours per cow. And, as expected, Utah, with its bigger herds, averaged four hours per cow.
Labor measured in cows per FTE (full-time employee equivalent): I continually hear a lot of discussion about the efficiency of manpower in running beef cows. Given the wide range in herd sizes of these four states, I expected a major difference here by state.
The seven-year herd average is 466 cows per FTE for the four states; however, there is a difference by state. North Dakota study herds average 530 cows per FTE, Nebraska averaged 457 cows per FTE, Minnesota averaged 307 and Utah averaged 704 cows per FTE. I fully expected to see significant economies of scale with respect to labor in beef cow herds.
Labor and management charge per cow: Ranchers generally do not consider a labor and management charge when they figure their costs of production. The farm business management associations, however, do put a charge on labor and on beef cow herd management.
The seven-year average labor and management charge for the four states combined was $70 per cow. There is considerable difference in the average labor and management cost per cow by state. North Dakota’s seven-year average was $73 per cow. Nebraska’s average was $71 per cow. Minnesota’s labor and management charge over the seven years averaged $96 per cow. Utah’s labor and management cost per cow was $36 per cow. Clearly, there are economies of scale in beef cow herds when it comes to labor and management cost.
Next month we will look at the economics of the herds in these four states over this same seven-year period in the current cattle cycle. I assure you that we will see some cattle cycle effects on the economic analysis of these herds.
Hughes is a North Dakota State University professor emeritus. He lives in Kuna, Idaho. Reach him at 701-238-9607 or [email protected].
About the Author(s)
You May Also Like




.png?width=300&auto=webp&quality=80&disable=upscale)
