Implications of the 2016 fall run
A glance at the numbers shows there are still lots of feeder cattle poised to head to the feedyards. What does that mean going forward?
January 6, 2017

Following USDA’s October Cattle on Feed report, this column highlighted some of the pertinent implications to follow. Specifically, the discussion focused on the limited placements during the month of September. The column included the following explanation:
USDA’s October Cattle on Feed report possessed some important implications. Most notably, placements in September totaled only 1.91 million head – down 2% versus 2015…While the year-over-year difference is relatively small, September was the first month since January that comparative placements were down versus 2015. During the previous seven months (February through August) monthly placements have averaged 7% above 2015 numbers and nearly equal with the five-year average. Meanwhile, October placements in 2016 were also down versus 2015.
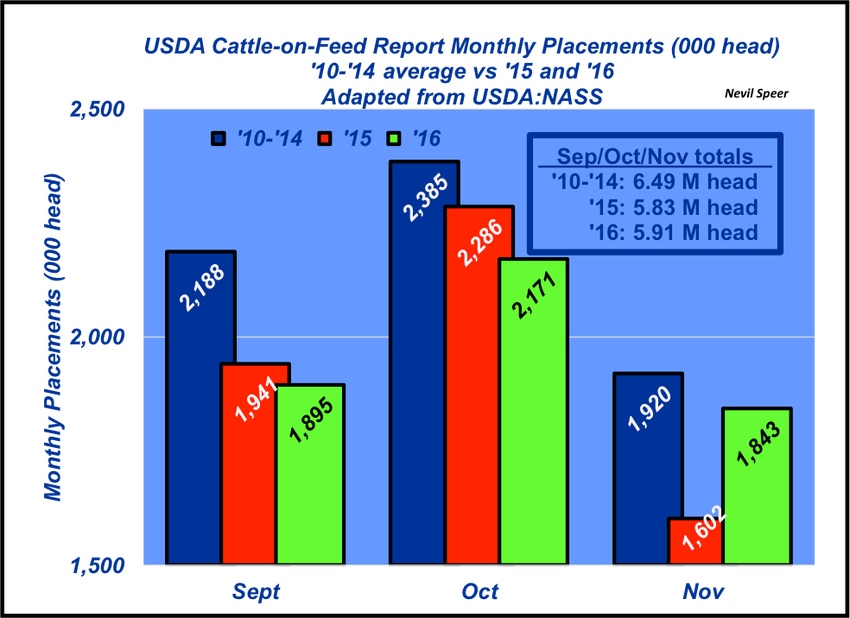
With that reality, the pre-report expectations for November placements were clearly biased toward compensation – that is, November would see more feedyard purchasing activity because of the relative slowness in September and October. Those expectations proved accurate. The report indicated 1.843 million head were placed in November – up 241,000 head, or 15%, versus last year.
However, as highlighted in this week’s graph, the three-month total (September, October, November) tells a broader story that has implications going into 2017. That is, the fall run totals for 2016 equal 5.91 million head – that’s only 80,000 bigger than last year, and that’s against a slow 2015 due to the last year’s sharp market downturn. Thus, for more context, a comparison to 2010-2014 is provided in the graph.
As noted previously in this column, feedyards are operating in an environment of bigger supply. Recall the Jan. 1 feeder cattle inventory outside feedlots was 1.3 million head larger than 2015. Total placements through August were up 834,000 head versus 2015. Tack on the additional 80,000 head during this year’s fall run (versus last year’s pace) and the difference totals to only 914,000 head.

In other words, there’s still about 400,000 head of cattle out on grass or in small grow yards waiting to be placed. Not to mention, we calved approximately 1 million more cows in 2016 compared with 2015.
It appears there are plenty of cattle out there that still need to make their way to the feedlot. That reality has several implications:
2017’s feeder cattle inventory count by USDA will be highly anticipated by traders.
Bigger numbers will likely limit upside seasonality for the feeder market this spring.
At some point, those feeder cattle have to be placed, fed and reckoned with on the other side – that could pressure the fed market at some point going forward.
Are you carrying over any feeder cattle into 2017? If so, what are your marketing plans for the coming year? Are you watching this carefully or just using up existing feed? How do you expect all this will play out from a supply flow in the coming year? Leave your thoughts in the comments section below.
About the Author(s)
You May Also Like


