Tyson operating margins vs S&P 500
How will Tyson’s Kansas beef plant fire affect the company going forward?
August 26, 2019

The recent fire at Tyson’s Holcomb, Kan., beef plant has evoked a large range of reactions within the industry. Most significantly, there’s been increased chatter among those entities inherently outspoken against the packing sector. That includes accusations of fraud, collusion, and price gouging. That all stems from the fact that packer margins were favorable before the fire and have since widened even further the past several weeks.
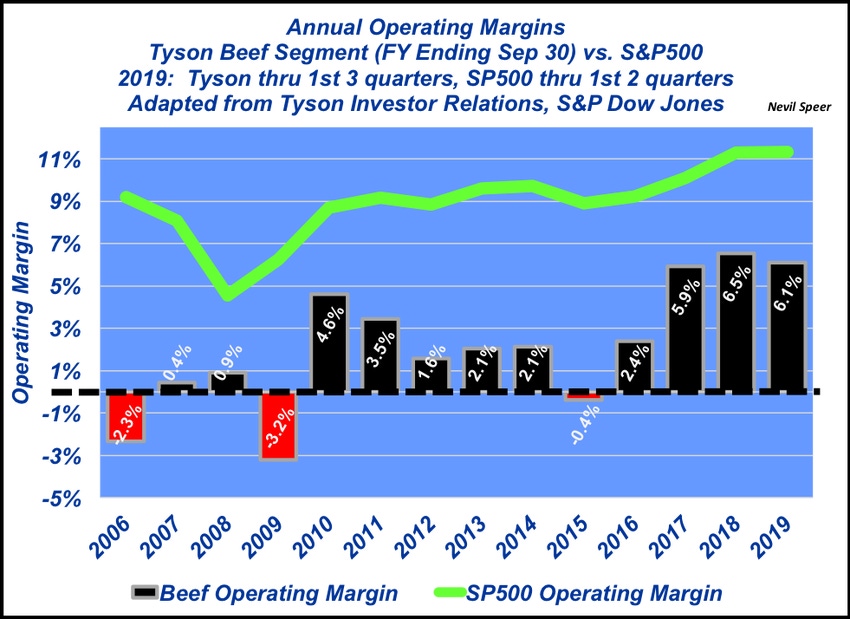
With that in mind, it’s useful to step back and look at the company’s operating results from a broader perspective. Accordingly, this week’s illustration provides some history with respect to beef operating margins and comparative values from the S&P 500.
For context, a few definitions are useful to ensure proper interpretation. Operating income depicts profit realized from a firm’s business operations. It’s a function of deducting operating expenses from gross profit.
In the case of Tyson’s beef segment, gross profit would be boxed beef and offal revenue less the cost of cattle. Subsequently, subtracting all operating expenses (wages, salaries, administrative expenses, utilities, insurance, depreciation etc. …) allows for calculation of operating income, also referred to as EBIT – earnings before interest and taxes.
Operating margin, which is reflected in the graph, is a function of operating income divided by total sales. Long-run analysis provides some insight into a company’s ability to generate operational profit with respect to sales. It also allows for some perspective around the company’s ability to cover expenses not associated with operations (interest and taxes).

As the graph indicates, Tyson’s best year on the beef side was in 2018 with an operating margin of 6.5% -- roughly two percentage points better than the previous peak in 2010. Meanwhile, through the first three quarters of fiscal year 2019, the company’s beef operating margin has averaged 6.1%. The company’s five-year average (‘14-‘18) equals 3.3%.
Comparisons across industries are always a little bit tricky. For example, Apple’s (AAPL) operating margin runs around 27%. However, the broader trend difference can tell an important story; it can help address the question of whether a company’s operating margins are keeping pace with general trends across all sectors, and hence whether they’re competitive in capital markets.
Therefore, the graph also depicts average annual operating margins for the S&P 500 (across all companies). Tyson’s beef segment operating margin, compared with the companies in the S&P 500, has lagged as much as 11.55% (2006) to just 3.66% (2008). Thus far in 2019, Tyson’s operating margin is roughly 5.25% behind the broader S&P 500 trend (6.1% vs 11.33%, respectively).
Leave your thoughts in the comments section below.
Speer serves as an industry consultant and is based in Bowling Green, Ky. Contact him at [email protected]
About the Author(s)
You May Also Like


.png?width=300&auto=webp&quality=80&disable=upscale)
