How to take advantage of today's record calf prices
We began a discussion last month on the detailed 2014 economic performance of a set of Northern Plains beef cow herds. I’m presenting these herd data so you can gain a more detailed perspective of what is happening in beef cow herds in this record-setting era. A “Your herd” column is presented in Figure 1 in hopes that you will benchmark as many numbers as possible from your herd.
Benchmarking is a powerful management tool that can help you identify your herd’s business strengths and weaknesses. Today’s ranchers are busy, busy people and have limited management time. Benchmarking helps suggest where you can focus that limited management time. Use benchmarking to capitalize on your business strengths and correct your business weaknesses, and profits will go up.
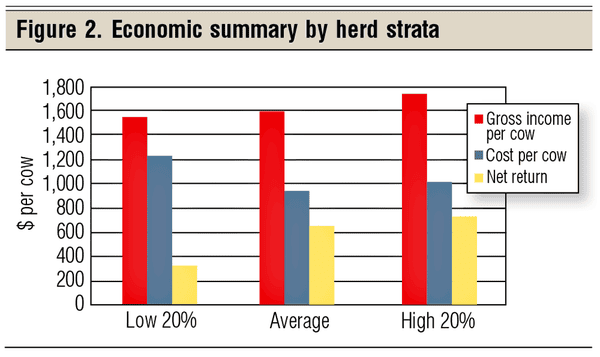
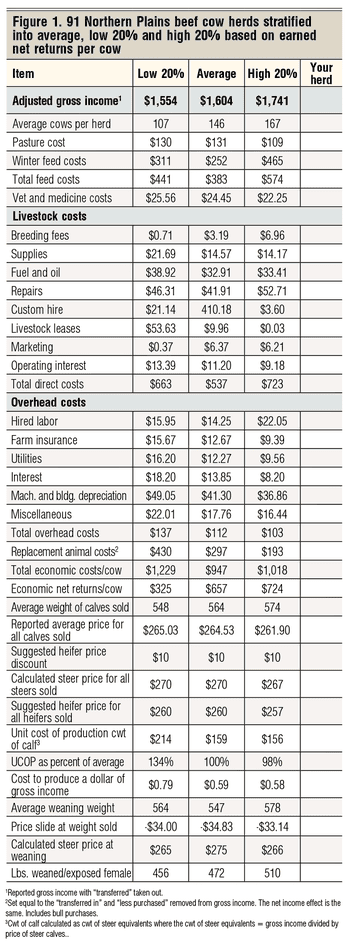 Since not all herds perform the same, it is generally useful to stratify study herds based on earned net returns and then see if we can determine why some herds are more profitable than others. These 91 Northern Plains herds were stratified into the group average, the top 20% and the bottom 20%, based on earned net returns per cow. Figure 1 shows the detailed results of this stratification. Let’s see if we can determine what put these herds into the different strata groups.
Let’s first take a detailed look at the economic performance of the average of these three groups. Let’s start this discussion by looking at the economic net returns per cow for these herds, about two-thirds down in Figure 1.
The average economic net returns per cow was $657, as presented last month. It is interesting to note that the high-profit, top 20% herds earned $724 per cow, a 10% higher earned economic return than average. The low-profit, bottom 20% herds earned $325 per cow, a return of 50% less. This is a range of $399 per cow among the three groups in earned economic net returns per cow.
Why is this? Let’s see if we can draw some conclusions that you might apply to your herd in 2015 and beyond to take advantage of today’s good times.
Let’s start by looking at adjusted gross income per cow. The average adjusted gross income per cow of the 91 herds was $1,604 in the Jan. 1 inventory, as spelled out last month. Most of the study herds calve in the spring, and culling has already occurred by the Jan. 1 inventory. The top 20% averaged $1,741, which was $137 per cow, or 8.5% more than the average. The bottom 20% averaged $1,554, $50 less per cow, or 97% of the average.
The average weight of calves sold was 564 pounds for the group, 574 pounds for the high 20% group and 548 pounds for the low 20% group. But, as you would expect, the price received was the highest for the group with the lightest average weight sold. Thus, calf income did not sort the herds into the different strata groups.

My conclusion, then, is that neither gross income nor marketing sorted the herds into the three groups.
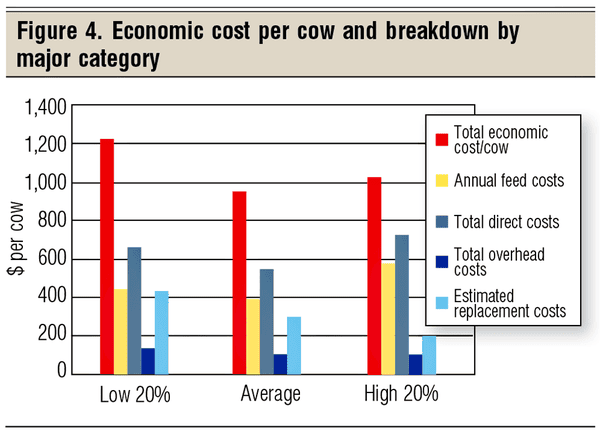
The average cost per cow for the 91 herds was $947, as was laid out in last month’s article. The high 20% herds had an average cost of $1,018, $71 more than the average of all herds, or 5% more cost per cow. High-producing herds do take more feed (yellow bars in Figure 4). However, the low 20% of the herds averaged $1,229 total costs per cow, $282 more than the average of all herds, or 30% higher.
So which are the most important metrics? A key difference in cost of the three strata was the estimated replacement costs for the low 20% group (Figure 4). It appears that ranchers in this group spent 45% more on raised or purchased replacement animals than the average, while the high 20% group spent 35% less on purchased or raised replacements.
I am not totally surprised that replacement costs made such a difference. My data suggest that developing replacement heifers in 2013 to start calving in 2014 was expensive due to high drought-induced feed prices. Some herds may have also been restocking in 2014, requiring added replacement costs. I suspect that replacement strategies and restocking strategies are very critical to profitability of beef cow herds. I hope to study these strategies more in the future.
Let’s take a look at my favorite production measure for a beef cow herd — pounds weaned per female exposed (Figure 5). If you think about this for a few minutes, you will see that this measure accounts for a lot of production factors.
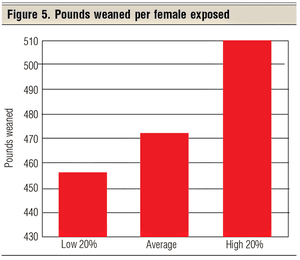 In my years of IRM (Integrated Resource Management) work, this production measure had the highest correlation with herd profit of any production measure I studied. The average of the 91 herds shows 472 pounds weaned per female exposed. The high 20% generated 510 pounds weaned per female exposed, 8% more than average. The low 20% generated 456 pounds weaned per female exposed, 3.3% less than average. I suggest that this production measure is the first half of the story.
Figure 6 presents the unit cost of production (UCOP) for a hundredweight of calf for each herd strata. The average UCOP for the 91 herds was $159 per cwt of calf produced. The high 20% of the herds averaged just a little lower, at $156 per cwt. The low 20% of the herds, however, averaged considerably higher, at $214 per cwt per herd. Again, this high unit cost was affected by the high replacement costs associated with the low 20% herds.
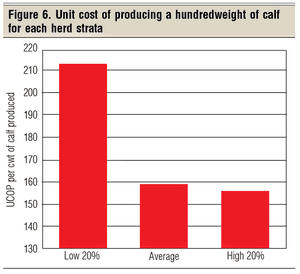 Thus, I suggest that the second half of the profit equation is to produce high output per cow, represented in Figure 5, at a low cost represented by Figure 6. I suggest that using the unit cost of producing a hundredweight of calf is the correct cost measure. This is a far better cost measure than cost per cow. Now we have an economic performance measure that takes both costs per cow and production per cow into account.
The point that is often missed when talking about UCOP is that the primary way, and about the only way, to lower unit costs of production is to increase production. Over the years, I have analyzed hundreds of herds; those with the lowest costs per cow are seldom, if ever, the low-unit-cost herd or the high-profit herd. Since ranchers tend to all receive similar prices for their calves sold, the variation in profit per herd is generally determined by each herd’s cost of producing a hundred pounds of calf.
In summary, the only effective way I know to increase profits in a beef cow herd is to lower unit costs of production per hundredweight of calf by increasing production per cow. The best measure of production per cow is pounds weaned per female exposed. Short of selling the herd, measuring and increasing pounds weaned per female exposed is the most effective way to take advantage of today’s record prices.
Harlan Hughes is a North Dakota State University professor emeritus. He lives in Kuna, Idaho. Reach him at 701-238-9607 or [email protected].
You might also like:
Basics and benefits of fixed time-AI
13 new utility tractors for the ranch in 2015
Who's the biggest seedstock producers in the U.S.?
How to prevent & treat pinkeye In cattle
Be watchful for toxic blue-green algae in stock ponds
How to get more than a preg-check from the vets preg-check visit
About the Author(s)
You May Also Like




.png?width=300&auto=webp&quality=80&disable=upscale)
