Cowherd trends: Are we stuck in neutral?
Several important metrics of cowherd efficiency haven’t changed over the past 10 to 15 years.
February 13, 2020

This column has routinely provided updates from data generated by the Kansas Farm Management Association (KFMA). Analysis of the enterprise reports over time enables some key insights into the decision-making process of beef producers. State management association programs allow farming/ranching participants to obtain comprehensive analysis of their respective enterprises which comprise the farm operation. That information subsequently leads to establishment of meaningful benchmarks for comparative purposes – both from a production and financial standpoint.
The KFMA data is especially useful from several perspectives. One, Kansas’ program is one of the largest in the country. Two, the data represents mostly mid-size (including both diversified and full-time) operations. Last, there’s a solid track record across all the data enabling meaningful comparisons over time.

The data represents five-year moving averages beginning with 1996-2000 and subsequently updated annually through 2017 (resulting from the 2018 analysis completed in 2019). Presentation of the five-year moving averages avoids year-over-year fluctuations that may occur due to weather and/or markets. What’s more, the moving averages enable a meaningful perspective of broader trends within the cow/calf sector.
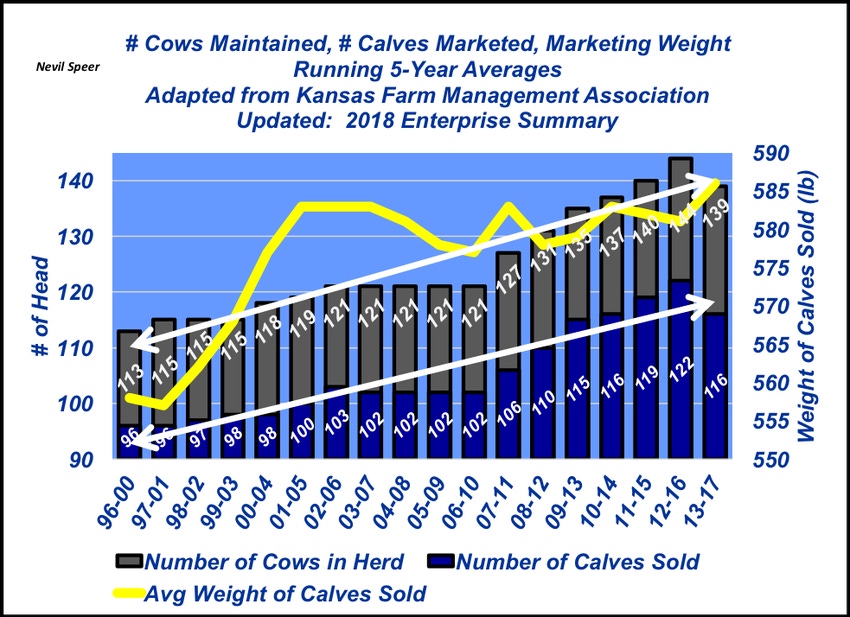
The key components in the graph include number of cows maintained, number of calves marketed and marketing weight. The trends are solidly consistent over time:
Cowherd size: Clearly, there’s been a trend toward managing more cows since the beginning of the data series. However, it seems that has leveled off in recent years around 135-140 cows, largely matching the broader trends across the country in terms of overall numbers.
Marketing rate: The relative proportion of calves marketed (or calf crop percentage marketed – aggregately determined by pregnancy, calving, and weaning percentages, respectively) has remained stubbornly stuck at about 85%. There’s been no major improvements – nor declines – in cumulative cow fertility and/or calf survivability.
Weaning (marketing) weights: Despite all indications of greater growth potential across the industry over time (e.g. bigger steer slaughter and carcass weight) marketing weight of calves hasn’t changed during the past 15 years. Producers continue to market their calves at the time they weigh around 600 pounds. With a 3% shrink, that translates to a 580-pound payweight.
Are these consistent with the trends you’ve seen in your area?
Nevil Speer serves as an industry consultant and is based in Bowling Green, KY. Contact him at [email protected].
About the Author(s)
You May Also Like


.png?width=300&auto=webp&quality=80&disable=upscale)
