For the average producer, a cow-calf operation loses money most years. How do you rank?
February 20, 2020

Last week’s Industry At A Glance initiated a renewed look at the most recent cowherd data available from the Kansas Farm Management Association (KFMA). Looking through the KFMA data always proves valuable – it provides for some key insights into general trends within the beef industry and the decision-making process of beef producers.
State management association programs allow farming/ranching participants to obtain comprehensive analysis of their respective enterprises which comprise the ranch operation. That information subsequently leads to establishment of meaningful benchmarks for comparative purposes – both from a production and financial standpoint. Those benchmarks also possess key implications for operations across the entire country.
As noted last week, KFMA data is especially useful. The Kansas program is one of the largest in the country and it’s comprised of mostly mid-size operations. Perhaps most significant, it’s a long-running program with excellent consistency over time, thereby providing a good handle on the real trends occurring within the participant operations.

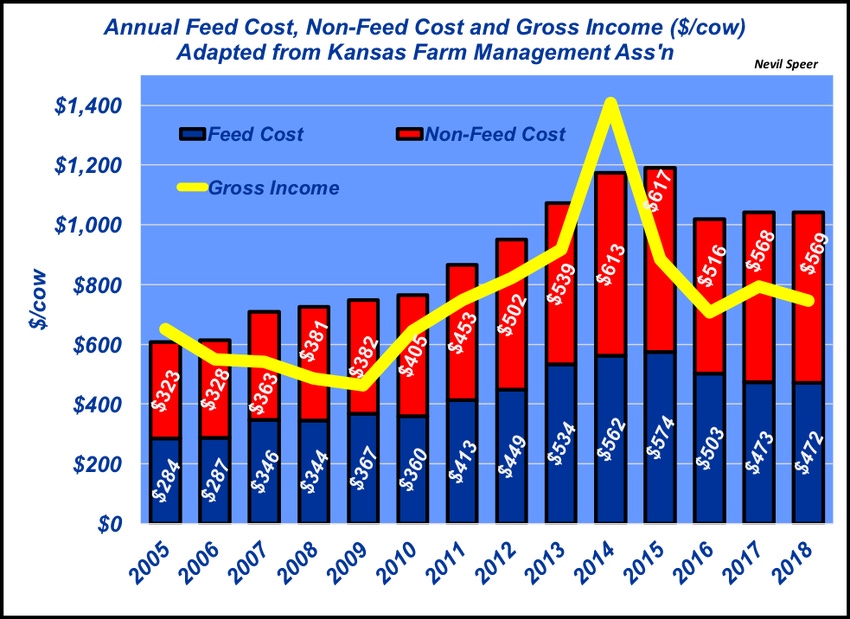
This week’s data represents annual gross income versus total cow costs, categorized by feed and non-feed costs. There are some key take-aways from the cumulative results:
Total cow costs have been north of $1,000 since 2013. Many producers “guesstimate” their costs and often report it to be closer to $700-800 per cow per year. The KFMA analysis is very thorough and this likely is a good representation of the true costs for much of the cow/calf sector.
Feed costs consistently run about 45% to 48% of total costs.
With the exception of 2005 and 2014, cow/calf operators – on average (more on that in a future column) – have lost money running cows. In other words, the average return to management has consistently been negative with costs outpacing gross revenue per cow.
How do these trends fit your operation? Are your (real) costs and generated income in line with these results?
Nevil Speer serves as an industry consultant and is based in Bowling Green, KY. Contact him at [email protected].
About the Author(s)
You May Also Like


