Subscribe to Our Newsletters
BEEF Magazine is the source for beef production, management and market news.
Here are the results and lessons of the 2014 BEEF Efficiency and Profitability Contest. How did you do?See the list of winners here. A special thank you to Circle X Land and Cattle Company, Bryan, TX, and Graham Land and Cattle Company, Gonzales, TX, for their extensive contributions to this project.No endorsement of products and services by Texas A&M AgriLife Extension and TAMU is implied.
November 3, 2014

In the September issue of BEEF and on beefmagazine.com, readers were provided with production data, pictures and videos for 12 steers, and asked to make estimates regarding their feedyard performance and carcass traits. Now, we’ll reveal the results of the animals’ feed intake, performance, carcass quality and profitability, and discuss the lessons.
The goal of this contest was to demonstrate the impact that individual animal variation in performance, feed efficiency and carcass quality have on the profitability of feedlot cattle, and to illustrate the importance of feed efficiency when evaluating the progeny from your herd. For this project, a relatively new method of standardizing feed efficiency called residual feed intake (RFI) was measured. Of the 12 steers presented in the contest, six had a negative RFI (efficient, or low) and six had a positive RFI (inefficient, or high).
The 12 steers used in this contest were selected from a population of 84 Brangus steers that were recently part of a research project that measured RFI. These calves were born and raised on a progressive beef-cattle operation in central Texas. The ranch has done extensive genetic and progeny testing of its cattle over the years, and does an excellent job of managing its cowherd and calves.
These steers were born in January and February 2013, underwent a VAC-30 preconditioning program and were weaned in August 2013. In order for the ranch to get more data on the progeny from the herd, including RFI, the steers were transported to the Beef Cattle Systems Research Center at Texas A&M University in College Station in late September 2013.
The steers were individually weighed, dewormed and assigned to pens equipped with electronic feed bunks using the GrowSafe SystemTM to measure each animal’s individual feed intake while fed a feedlot diet for 98 days. The steers were then shipped to a commercial feedyard, and fed a feedlot diet in a single pen for an additional 152 days prior to harvest at a commercial slaughter and processing plant.
Carcass data were collected to determine USDA Yield and Quality Grade, while carcass value and income were determined using a carcass-pricing grid. One strip loin steak was collected from each carcass for measurement of Warner-Bratzler shear force following a 14-day postmortem aging period.
RFI measures feed intake beyond what is needed to support maintenance and growth energy requirements. RFI is calculated as the difference between an animal’s actual dry matter (DM) intake and its expected DM intake based on its body weight and level of production.
“Efficient” cattle are those that eat less feed than expected based on their body weight and performance (e.g., growth rate), and are classified as having a negative, or low, RFI. “Inefficient” cattle are those that eat more feed than expected based on their body weight and performance. These are classified as having a positive, or high, RFI.
Unlike traditional ratio-based efficiency traits like feed-to-gain ratio (F:G), which are highly influenced by growth and maturity patterns, RFI is minimally related to the animal’s body size or level of production. This is illustrated in the accompanying scatter graph on page 16 where RFI is plotted against average daily gain (ADG) for the 84 steers used in the project.
Since F:G is strongly correlated with growth in an inverse manner, use of F:G as a selection criterion would result in an increase in the mature size of the cowherd. Meanwhile, RFI is an efficiency trait that allows producers to evaluate genetic merit for net feed efficiency independent of growth and mature size.
Net revenue (NR) for each steer was calculated as carcass income (hot carcass weight x grid-based carcass value), minus total expenses. These expenses include the cost of the feeder calf, yardage (25¢/day), processing and transportation ($68/head), feed and interest.
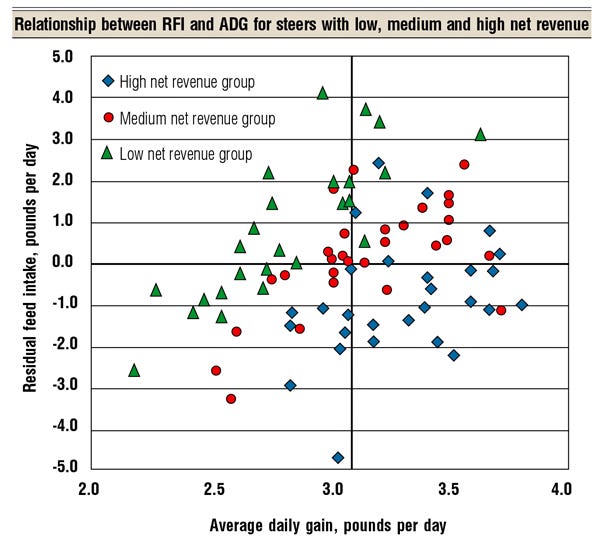
The scatter graph illustrates that animal differences in both RFI and ADG heavily influenced profit. The most profitable steers (blue diamonds) were those that had above-average gains (right half of the graph), above-average RFI (lower half of the graph), or both (lower right quadrant of the graph).
Conversely, those steers that generated the least profit (green triangles) either had below-average gains, below-average RFI or both (upper left quadrant). Note that the impact of individual animal differences in carcass-quality traits, which also affected profit, is not illustrated in this graph.
Even though the six high-RFI steers gained slightly more in the feedyard (0.16 lb./day) than the six low-RFI steers, the low-RFI steers ate 1,636 lbs./steer less feed over the 250-day feeding period. It is interesting to note that, within this group of 12 steers, there was considerable variation in pounds of feed consumed. For instance, Steer 2 ate 25.7 lbs./day of feed, while Steer 8 only consumed 15.1 lbs./day.
Despite this large difference in daily feed consumption, both steers gained at similar rates. Imagine how much more efficient and sustainable our cattle industry would be if the average market steer and heifer ate 10 lbs./day less feed while maintaining similar gains during the finishing phase.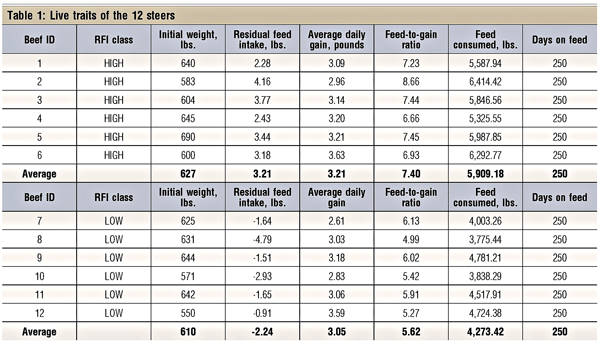
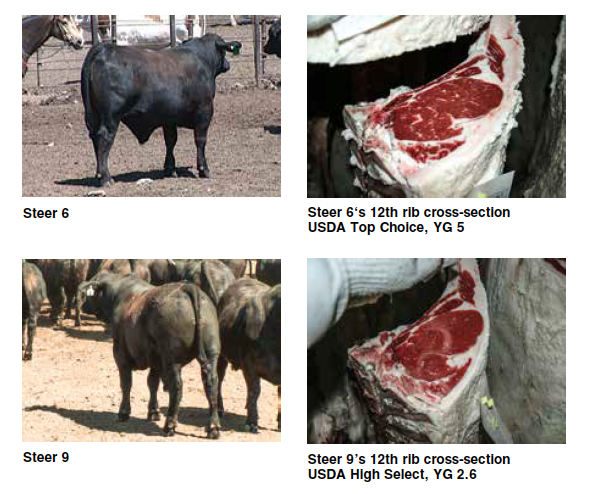
Results from the carcass data showed a similar trend to those found in other previously conducted RFI research studies. The high-RFI steers tended to be fatter and have smaller 12th-rib rib-eye areas, and less-desirable USDA Yield Grades than the low-RFI steers. This is logical, as it is less efficient for a steer to gain a pound of fat than a pound of lean muscle.
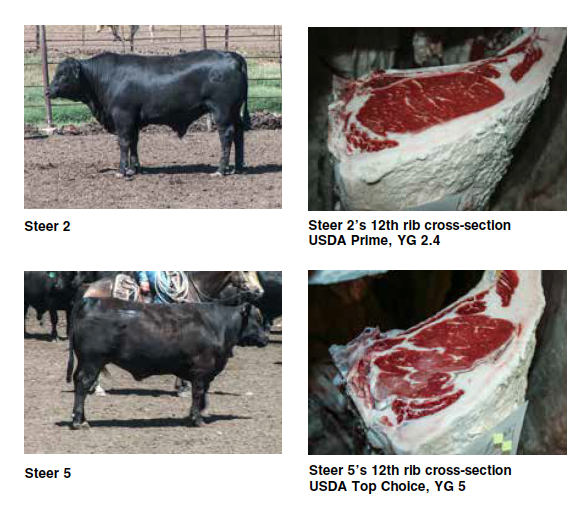
The USDA Quality Grade for these Brangus steers was exceptional. Steer 2 produced the best carcass, as it was a USDA Prime Yield Grade 2 carcass. This ranch has used marbling as a selection criterion in identifying herd sires, and it has paid off. Only one of the 12 steers (Steer 9) did not grade USDA Choice or Prime, while seven of the 12 steers graded Top Choice or better.
While Top Choice is not an official USDA Quality Grade, there are several branded-beef programs that require a modest degree of marbling or better. These branded-beef programs are referred to as Top Choice programs. However, most Top Choice branded-beef programs have other specifications, such as a minimum and maximum carcass weight, a maximum numerical USDA Yield Grade, a maximum 12th-rib fat thickness and/or a minimum and maximum 12th-rib rib-eye area.
The Top Choice branded-beef program used in the carcass value grid for this contest did not accept USDA Yield Grade 5 carcasses. Therefore, even though Steers 5 and 6 had modest degrees of marbling or greater, they were not given the $4/cwt. premium for Top Choice branded beef because these steers produced USDA Yield Grade 5 carcasses.
In evaluating the data for all 84 steers, there were no significant differences found in tenderness between carcasses from the low- and high-RFI groups, or between the low and high net-revenue groups, which is in agreement with most previous studies.
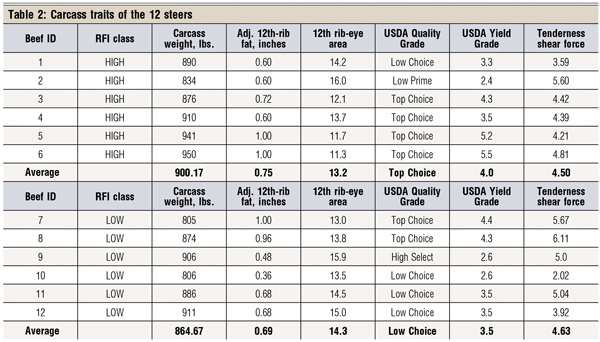
When tenderness was measured using the Warner-Bratzler shear machine, all the strip loin steaks from the 12 Brangus steers that were part of the contest rated in the “tender” range. Warner-Bratzler shear force represents the pounds of force required for a metal blade to cut through a ½-in. core of steak. The threshold often used to identify tender steaks is a value less than 8 lbs. of force. All the steaks from the 12 animals in this contest were well below that threshold.
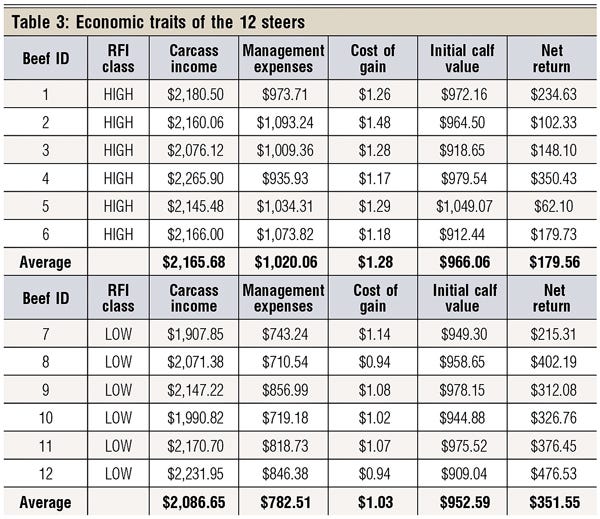
Table 3 shows the economic traits for the 12 steers. The bottom line for the economic picture is that the six low-RFI cattle (Steers 7 to 12) returned an average of $172/head more profit to the rancher than the six high-RFI cattle (Steers 1 to 6).
Even though the high-RFI steers produced heavier carcasses and had better USDA Quality Grades, resulting in greater income from selling carcasses on the carcass-pricing grid, the low-RFI cattle overcame the slightly lower carcass income with a substantially lower management expense (specifically, the cost of feed). The cost of gain for the low-RFI steers was 25¢ less for every pound they gained when compared to the high-RFI steers.
Interestingly, Steer 2, which produced the best carcass, had the second-lowest net return ($102.33) because it had the highest cost of gain of all 12 steers. Steer 5 had the lowest net return to the rancher ($62.10), in large part because the initial value of the feeder calf was the highest, and this steer received a substantial discount on the carcass-pricing grid ($160) for producing a USDA Yield Grade 5 carcass. Steer 12 had the highest net return ($476.33), because it was efficient, had a high ADG, had the lowest initial feeder-calf value and produced an acceptable carcass. In other words, Steer 12 put it all together by performing well in the feedyard and in the cooler.
If you look at all 12 feeder calf pictures presented in the September issue of BEEF and on beefmagazine.com, you will see that all these cattle looked similar phenotypically. They are Brangus cattle from one ranch. However, when you look at the data presented in the tables, it is evident that there is considerable variation among steers in their performance, feed efficiency and carcass value that impacts net returns. For example, there was a $414.43 difference in net return between Steer 12 and Steer 5.
When all 84 steers were ranked by RFI (lowest to highest), the top “third” (low RFI; efficient) generated on average $145 more profit than the bottom “third” (high RFI; inefficient).
Results from the production data presented in this contest demonstrate the value of selecting cattle that have above-average genetic potential for growth, feed efficiency and carcass quality. This information also demonstrates that feed-efficiency measures such as RFI are very important in improving the net return on your market steers and heifers. You can find pictures of all 12 finished steers, as well as the 12th-rib rib-eye picture for each steer and more information about RFI, on the BEEF Efficiency and Profitability Contest website at beefmagazine.com.
1. Which calf produced a carcass with the highest USDA Quality Grade? Answer: Steer 2, Low Prime
2. Which calf produced a carcass with the highest numerical USDA Yield Grade (indicating lowest percent lean meat)? Answer: Steer 6, YG 5.5
3. Which calf’s carcass produced the lowest numerical USDA Yield Grade (indicating highest percent lean meat)? Answer: Steer 2, YG 2.4
4. Which calf produced the most tender strip loin steak (lowest shear force score)? Answer: Steer 10, 2.2 lbs. of shear force
5. What percent of the carcasses were USDA Choice or Prime (rounded to the nearest 10%)? Answer: 91.7%, 11 out of 12
6. Which calf had the highest ADG from its initial feeder-calf weight to the final finished weight? Answer: Steer 6, 3.63 lbs./day
7. Which calf ate the least feed throughout the feeding period? Answer: Steer 8, 3,775.4 lbs.
8. Which calf had the highest net return (calculated by the carcass income from selling on the grid minus the initial cost of the feeder calf and all expenses including feed, processing, interest and shipping)? Answer: Steer 12, $476.53
9. Which calf had the lowest net return? Answer: Steer 5, $62.10
10. What is the total difference in net return between the six low-RFI cattle and the six high-RFI cattle? Answer: $1,031.98
Tiebreaker – From the start of the project until the day of harvest, how many fewer pounds of feed did the six low-RFI steers eat compared to the six high-RFI steers? Answer: 9,815 lbs.
You May Also Like
Enter a zip code to see the weather conditions for a different location.