Costs and profitability: Where do you rank?
Profitability is difficult to come by when accounting for all costs.
July 21, 2016

In previous weeks, we’ve focused on some pertinent data from Kansas Farm Management Association (KFMA) analyses. KFMA data provide a useful look into ongoing trends across the cow-calf sector. The data are fairly representative of the general sector from several perspectives: KFMA is one of the largest programs in the country, the data represents mostly mid-size (including both diversified and full-time) operations, and possess a long-standing track record, enabling meaningful comparisons over time.
The KFMA data we looked at last week reveals that running cows is always profitable if considering feed costs only. However, inclusion of non-feed costs establishes a different perspective. That is, profitability is difficult to come by when accounting for all costs.
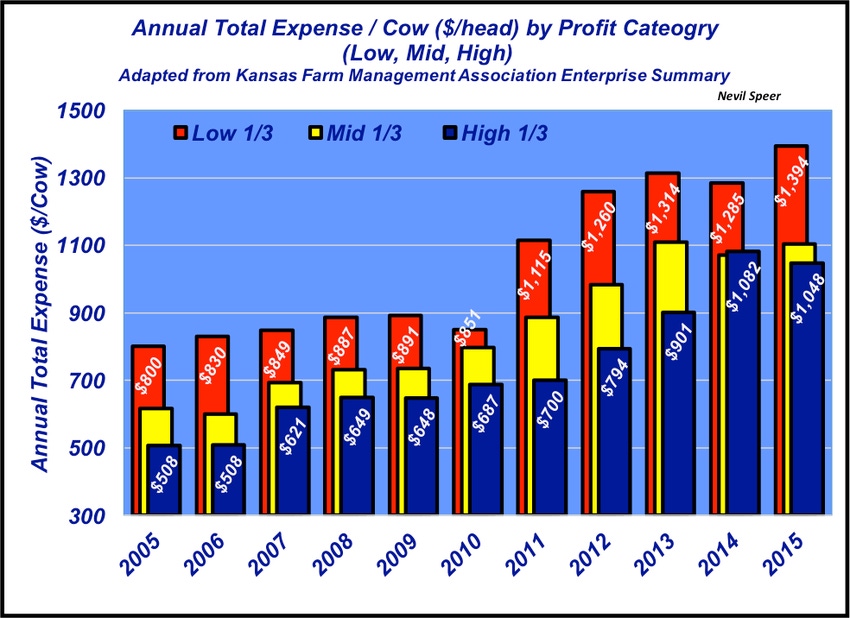
This week’s graph provides somewhat of a different comparison. It outlines cow costs by profit segments: bottom third, middle third and top third. For example, operations that fell in the bottom third of profitability possessed total annual expenses (both direct and indirect costs) of nearly $1,400. Meanwhile, operations in the top third profit segment managed to shave nearly $350 per cow off that mark. In other words, the bottom-profit segment spent 33% more versus the most profitable segment, and over 25% more ($290 per cow) when compared to the middle segment. 
Similarly, KFMA provides some important insight into profitability at the cow-calf level. Specifically, the report notes that, “…even in the ‘good years’ some producers are losing money and even in the ‘bad years’ some producers are making money.” This is important because it indicates there are management changes producers can make to seek to improve their operations. “And most importantly, KFMA summarizes that, ‘...analysis suggests that while both production (weight) and price do impact profit, they are much less important in explaining differences between producers than costs.’”
How might you adjust financial analysis of your operation based on the data above? Where are you looking to cut costs? How much room do you have to reduce costs going forward? Leave your thoughts in the comments section below.
Nevil Speer is based in Bowling Green, Ky., and serves as vice president of U.S. operations for AgriClear, Inc. – a wholly-owned subsidiary of TMX Group Limited. The views and opinions of the author expressed herein do not necessarily state or reflect those of the TMX Group Limited and Natural Gas Exchange Inc.
You might also like:
4 facts to debunk "Meat is horrible" article
60 stunning photos that showcase ranch work ethics
Best risk strategy options for cattle producers
Does it really take six years to cover your costs on a cow? NO!
Photo Gallery: Get to know the 2016 Seedstock 100 operations
About the Author(s)
You May Also Like


.png?width=300&auto=webp&quality=80&disable=upscale)
