Cow cost trends: How does your operation compare?
While direct or operating costs are generally easy to account for, indirect costs are much harder to establish.
July 14, 2016

Last week’s column highlighted broader cow-calf production trends from recent Kansas Farm Management Association (KFMA) analyses. This week, we’ll drill a little deeper into the data. We’re using KFMA data because it’s especially useful from several perspectives. One, Kansas’ program is one of the largest in the country. Two, the data represents mostly mid-size (including both diversified and full-time) operations. Last, there’s a solid track record across all the data, enabling meaningful comparisons over time.
The current market environment has producers extremely mindful of their operation’s cost structure. However, meaningful data for comparison purposes is often difficult to come by. While direct or operating costs (e.g. feed) are generally easy to account for, indirect costs are much harder to establish. It’s challenging and time-consuming for many operations to properly account for all overhead and indirect costs, such as labor, machinery and equipment. As such, KFMA data provides some important baselines for comparison purposes.
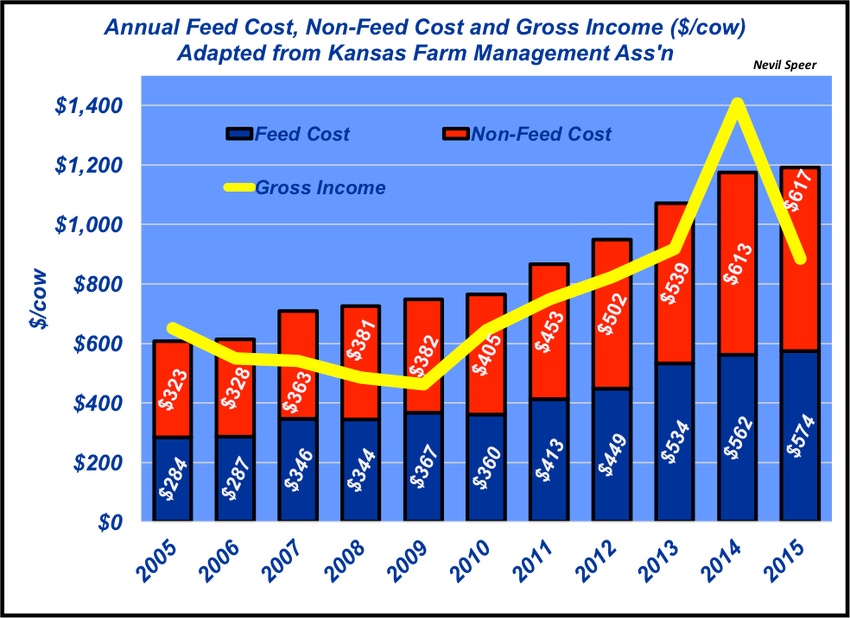
This week’s illustration includes the most recent (2015 analyses) KFMA data: annual cow-calf operation feed costs, non-feed costs and gross income. The data reveal that running cows is always profitable if considering feed costs only. However, inclusion of non-feed costs establishes a different perspective. That is, profitability is difficult to come by when accounting for all costs.

As noted in a previous column, there exists a lot of variability around cow-calf operational costs. The column cited Livestock Marketing Information Center (LMIC) data indicating that total costs have surged sharply higher in recent years – increasing an average of 5.6% annually and now average nearly $900 per head). Clearly, the KFMA accounting represents a much higher overall cost. However, in a similar fashion to LMIC estimates, KFMA costs have increased an average of 7% annually over the past 10 years.
How does the data detailed above line up with your cost structure? How extensively do you analyze your costs? What’s your assessment of cow profitability in the years to come? Where do you see the cost trend headed? Given the current market trend, how might you adapt your decision making around costs to keep up? Leave your thoughts in the comments section below.
Nevil Speer is based in Bowling Green, Ky., and serves as vice president of U.S. operations for AgriClear, Inc. – a wholly-owned subsidiary of TMX Group Limited. The views and opinions of the author expressed herein do not necessarily state or reflect those of the TMX Group Limited and Natural Gas Exchange Inc.
You might also like:
4 facts to debunk "Meat is horrible" article
60 stunning photos that showcase ranch work ethics
Best risk strategy options for cattle producers
Does it really take six years to cover your costs on a cow? NO!
Photo Gallery: Get to know the 2016 Seedstock 100 operations
About the Author(s)
You May Also Like


