Is the cattle cycle back? Part 2 of a 2-part series
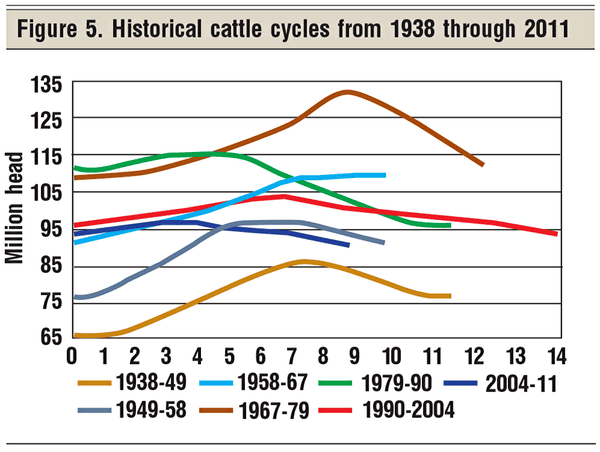
Last month’s column looked at 80 years of cattle cycles — each lasting from nine to 11 years. My goal this month is to project the next cattle cycle and its related price cycle.
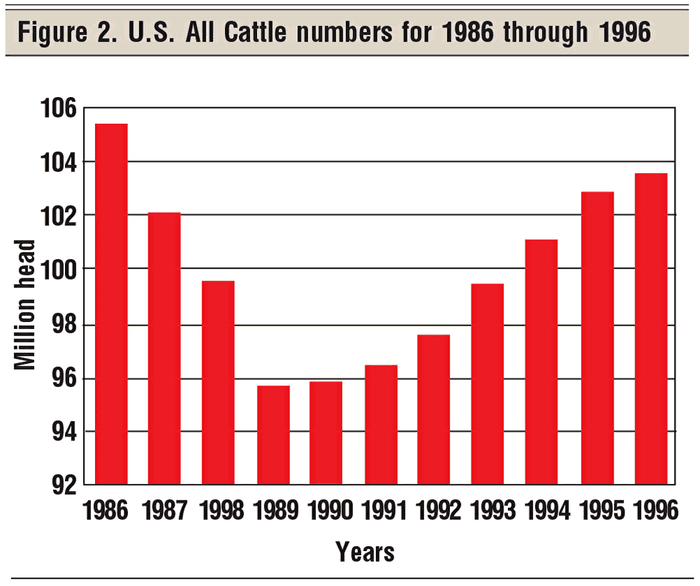
Let’s start with a look back at some historical data. Figure 2 shows the U.S. All Cattle numbers from 1986 to 1996. Compare that to Figure 1 and note that cattle prices tend to go in the opposite direction that cattle numbers go. Since beef cow producers in the aggregate respond to beef prices, cattle numbers tend to mirror beef prices, but with a biological lag.
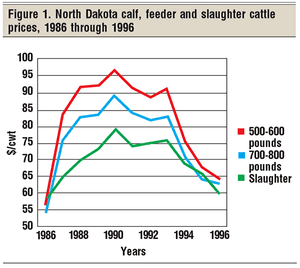 Please note five things about Figure 1:
The distances between the three price lines (Figure 1) change as we go through the price cycle.
The distance between the price lines implies different buy/sell margins directly impacting post-weaning enterprises.
The larger the buy/sell margin, the harder it is to make money with post-weaning enterprises.
Beef prices tend to go in the opposite direction of cattle numbers.
In Figure 2, note the U-shaped cattle numbers cycle and the opposite shape of the cattle price cycles (Figure 1).
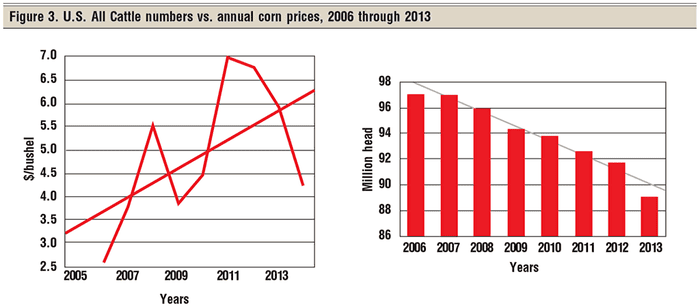
Fast-forward 10 years to 2006. The seven years of volatile corn prices from mid-2006 through 2013 turned the cattle industry upside down and, basically, broke the cattle cycle (Figure 3). Note the trend line for corn prices over these seven years, and then note the trend line in Figure 3 for U.S. All Cattle numbers. Basically, from 2006 to the present, the cattle cycle has been broken.
Will we see cattle cycles again? Assuming that corn prices stay reasonably stable, as we saw before 2006,
I would answer “Yes, I think so.”
Cattle cycle theory
Let’s now review the theory of cattle cycles. Hopefully, this will help clear up the concept of cattle cycles and beef price cycles. I am turning to a master’s degree thesis at the University of Wyoming to help explain cattle cycles. Figure 4 was taken from that Wyoming master’s degree thesis published in early 2000s.
Let’s review this chart in detail and try to grasp this researcher’s concept of cattle cycles. He uses three relationships in this cattle cycle diagram: cattle prices, cattle numbers and harvest numbers. There are four stages of a cattle cycle listed across the top of the diagram. The stages are:
• Rebuilding stage
• Exhaustion stage
• Sell-off stage
• Last stage
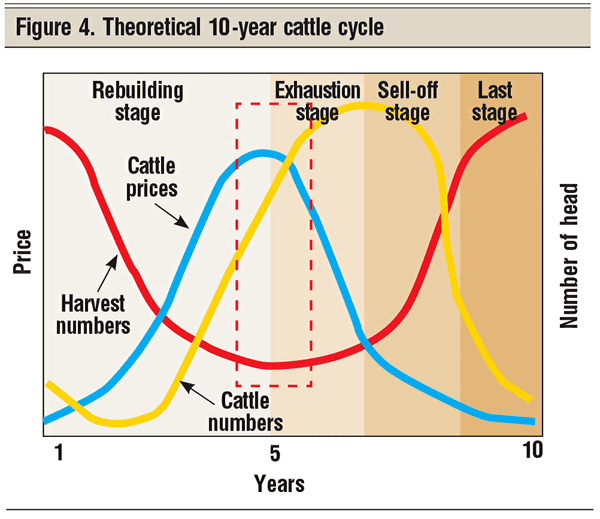
Rebuilding stage: Starting on the left-hand side, which we’ll call year 1, cattle numbers (the yellow line) are going lower, so the harvest number (the red line) is also going lower. As harvest numbers continue down from year 1 through year 5, prices keep increasing. Increasing prices, in turn, stimulate increasing cattle numbers through heifer retention. But due to the biology of the beef cow, the cattle number increases lag the price increases. Harvest numbers go lower and lower as heifers are diverted from feeding to breeding. Note the low in harvest numbers around year five. This is where we are now, sort of.
Exhaustion stage: Prices finally peak out somewhere around year five and turn downward. Due to the lag in heifer development, cattle numbers keep building even as prices turn lower. Lower prices finally stimulate less heifer development and even some selling of mature cows, leading to even more harvest numbers. Increased harvest numbers pressure prices even lower.
Last stage: Finally, lower prices stimulate even more harvest numbers, and prices reach a bottom. Then, the cycle starts over again.
Some things to note about Figure 4:
The cattle numbers cycle lags the price cycle.
Harvest numbers run countercyclical to price.
The price cycle causes cattle number cycles; i.e., ranchers hold back more heifers as prices increase and sell off more females when prices are low.
The price cycle and numbers cycle together drive the harvest cycle.
While in theory the cattle cycle, price cycle and harvest cycle move in nice smooth curves, in reality these curves are not so smooth. These theoretical curves, however, can help us all perceive how the cattle cycle and price cycle will tend to go through time.
Projecting the next cattle cycle
Record beef cow profits in 2014, coupled with a favorable corn prices outlook, clearly triggered an interest in herd expansion. Existing cattle producers are asking me about holding back additional heifers, and I am getting phone calls from outsiders wanting to own beef cows. Yes, the next cattle cycle in now underway.
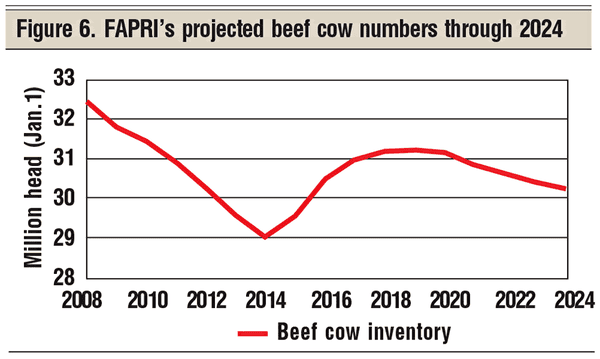
Let’s turn to data from the University of Missouri’s Food and Agricultural Policy Institute (FAPRI) to project the next cattle cycle ahead for nine to 10 years. Figure 6 presents FAPRI’s spring 2015 projected U.S. national beef cow numbers through the next cattle cycle. Note that the numbers suggest a five-year expansion phase projected to peak about at the same level as the year 2010. Then, we will have five years of slow, decreasing beef cow numbers completing the cycle somewhere around year 2024. I will use this for my next cattle cycle projection.
I decided to overlay my price projections over FAPRI’s projected U.S. All Cattle Inventory numbers for the next cattle cycle. FAPRI focuses its feeder cattle price projections on Oklahoma City 600- to 650-pound steer prices. Figure 7 presents historical Oklahoma City prices and U.S. All Cattle numbers for 2008 through 2014. The data for 2015 through 2024 are FAPRI’s projected All Cattle numbers and projected Oklahoma feeder cattle prices for the 2015 through 2024 time period.
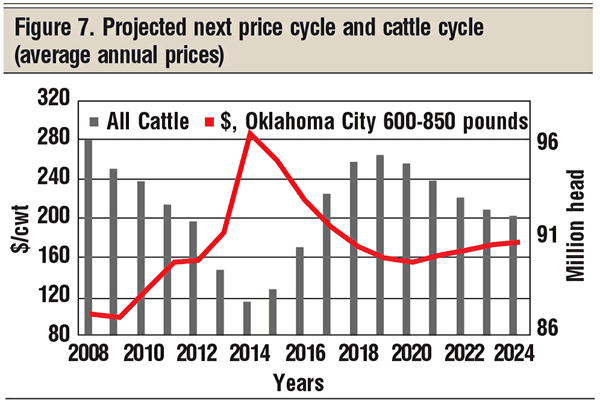
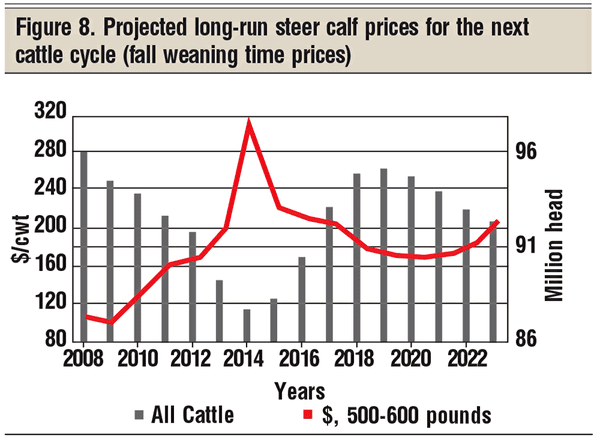
Figure 8 presents my projected fall weaning steer calf prices for the eastern Wyoming/western Nebraska region for the next cattle cycle. The prices in Figure 8 for 2008 through 2014 are my historical fall weaning prices, including my September 2015 projected $242 fall weaning price. The 2016 through 2023 lines are my projected long-run planning prices based heavily off FAPRI’s projected Oklahoma City 600- to 650-pound feeder prices.
The projected fall 2015 weaned steer price is down substantially from the record high in 2014; however, if this projection comes true, this 2015 weaning price is still the second-highest on record.
Harlan Hughes is a North Dakota State University professor emeritus. He lives in Kuna, Idaho. Reach him at 701-238-9607 or at [email protected].
You might also like:
Gallery: A waterer that never freezes? It's true!
Is the cattle market whiplash over?
What's ahead for 2015 on the cow-calf side?
Enjoy a laugh on us! Holmes and Fletcher classic ranch cartoons
About the Author(s)
You May Also Like
