Putting beef checkoff revenue in perspective
The beef checkoff helps the beef business in many ways. Here’s a look.
September 6, 2018

There’s neither time nor space in this column to cover all the dynamics surrounding the current beef checkoff litigation. However, at this juncture, some objective perspective is useful to understanding the beef checkoff itself.
First, there’s consideration of the most recent independent analysis of the return on checkoff investment. Harry Kaiser, a professor at Cornell University, reported in 2014 the return to the beef industry for every dollar of investment underwritten by the Cattlemen’s Beef Board activities equals $11.20.
Second, that reality is reflected by dramatic improvement in beef demand during the past 20 years—the outcome of improved consistency and quality that’s occurred across the beef industry. Much of that occurrence is the direct result of the initiation and follow-through of efforts like the National Beef Quality Audits.
Additionally, ongoing beef promotion has played a large part in helping grow and reinforce beef demand. The cumulative effect of those efforts has led to unprecedented pricing power for beef in the marketplace. For more info see: Retail Prices are Defying Gravity.)
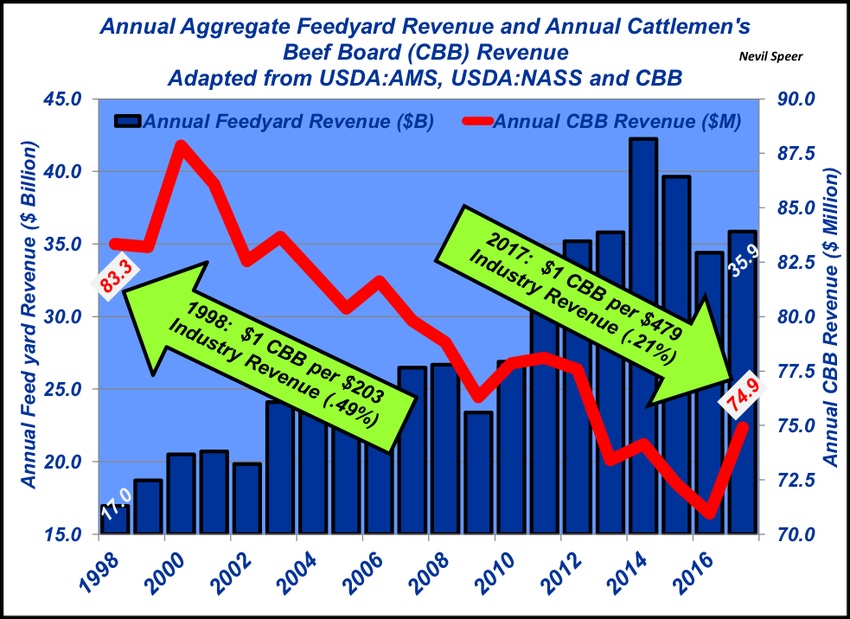
With all that in mind, some tangible, direct, producer-oriented context is also helpful. This week’s graph looks at relative comparison among two key measures: industry revenue and total checkoff dollars.
Over the years, Industry At A Glance has regularly reviewed aggregate feedyard revenue. It provides an indicator of total dollars entering the production sector. Thus, it’s a measure of funds that are making their way back upstream to backgrounders, stockers and cow-calf operations.
This week’s illustration goes back to 1998 when beef demand bottomed, reflecting the two measures. Total feedyard revenue in 1998 equaled $17 billion. Fast forward 20 years: Revenue has more than doubled and encroached $36 billion in 2017.

Now compare the total revenue for the Cattlemen’s Beef Board (CBB). It’s gone the other way, equaling $83.3 million in 1998 versus only $74.9 million in 2017, just under 90% of the 1998 total 20 years earlier.
Putting that into context looks like this: The beef checkoff requirement hasn’t changed over time. It’s still $1 per head. In 1998, that investment meant CBB received the respective $1 checkoff from every $203 generated by the industry.
Fast forward to 2017. The industry generated $479 of production revenue for every $1 per head collected.
Viewed in a different way, the 1998 checkoff investment was equivalent to 0.5% of feedyard revenue. That’s since declined to only 0.2% in 2017. In other words, from a total revenue standpoint, CBB’s 2017 revenue was equivalent to only 40 cents on the dollar in comparison with 1998.
That ultimately means CBB has experienced a dramatic cut over time with respect to the total size of the industry. All the while, though, CBB has managed to help move the industry forward in a favorable direction. Considering the real shift in demand and favorable ROI assessments, the CBB has provided outstanding performance from the standpoint of both efficiency and effectiveness.
Leave your thoughts in the comments section below.
Speer serves as an industry consultant and is based in Bowling Green, Ky. Contact him at [email protected]
About the Author(s)
You May Also Like


