Struggling with profitability? Start with cow costs
Data shows that if you’re struggling with profitability, the place to start is on the cost side.
December 5, 2018

Industry At A Glance during the past several weeks has focused on the key differences between operations as it pertains to profitability, based on Kansas Farm Management Association (KFMA). Most significant, annual cow costs, both direct and indirect costs, are the largest contributor to segmenting differences between high-profit versus low-profit groups within the data.
Between 2005 and 2017, the average cow cost was $748, $858, and $1,046 for the top, middle and low profit groups, respectively. That represents a $298 difference between the high and low categories, or 40%.
That’s contrary to conventional wisdom; that is, many producers focus strictly on marketing weight and selling price as indicators of profitability. The data tell an important story. For example, the average sales price over the past 13 years stood at $138.70, $140.25, and $135.70 per cwt for the high, mid and low profit groups, respectively.

In other words, there’s no real difference between the groups when it comes to selling price – at least not one which would explain the large differences in profitability.
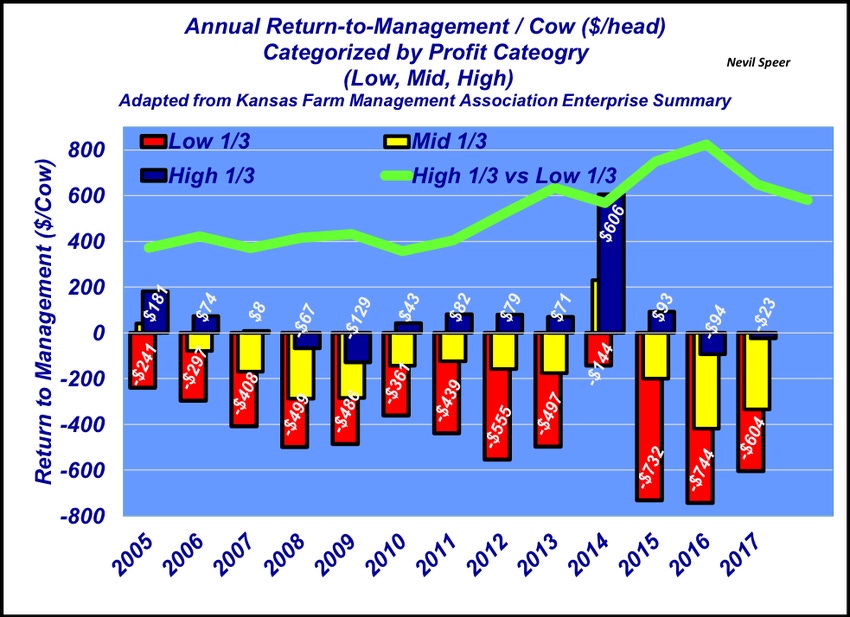
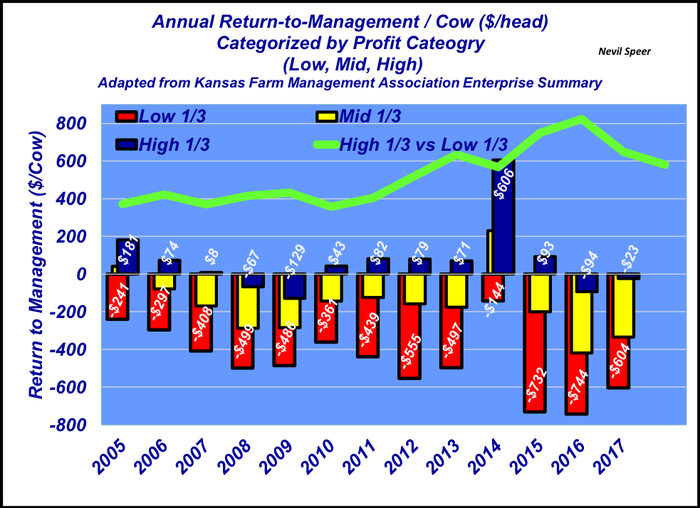
All of that brings us to the most important part of this discussion – annual return to management. This week’s graph highlights the annual returns categorized by profit group since 2005. The high-profit group averaged an annual return of $80 per cow during that time frame. On the other side, though, the low-profit group experienced an average loss of $441 per cow per year – a difference of over $500 per cow!
Looking at it from a different perspective, the low-profit producers average herd size was 94 cows. That size herd with a loss of $441 per year over the span of 13 years totals to nearly $540,000! Clearly, participants come and go in KFMA – these aren’t the same operations year over year. But nevertheless, they are representative of mainstream operations – and that sort of scenario represents a significant difference in cash burn and overall returns over time.
Bring this all full circle with respect to costs, the difference in cow costs over the years accounts for nearly 60% of the difference in return to management. The take-home message being, if you’re struggling with profitability, the place to start is on the cost side.
How carefully are you monitoring your operation’s profitability? Are you participating in some sort of benchmarking program where you’re able to compare your costs with other producers? Leave your thoughts in the comments section below.
Speer serves as an industry consultant and is based in Bowling Green, Ky. Contact him at [email protected]
About the Author(s)
You May Also Like


.png?width=300&auto=webp&quality=80&disable=upscale)
