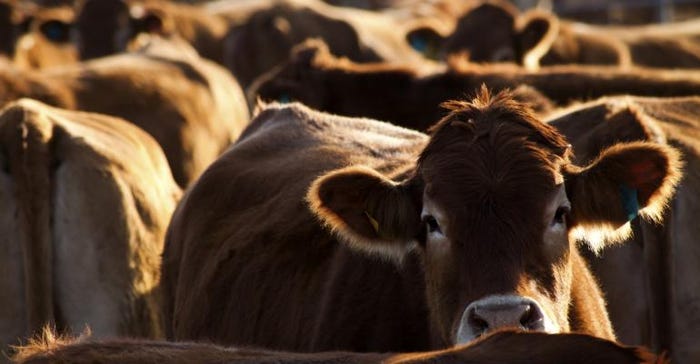
Apparently, the market and its rationing fundamentals still work.
September’s World Agriculture Supply and Demand Estimates lowered the season-average corn price 30¢/bu. on both ends of the range to $7.20-$8.60/bu. That reflects U.S. corn supplies projected to be 108 million bu. higher than the previous month’s estimate, stemming mostly from a projected reduction of 150 million bu. in feed and residual use for 2011-2012, resulting in a higher carry-in to the new crop year. Estimated 2012-2013 production was lowered by 52 million bu.
Another Look: Corn Crop: How Short Is Short And How High Is High?
Since then, it’s not like the floor has fallen out beneath prices, but earlier harvest progress and better yields than expected for some crops have at least pressured grain prices, although also increasing price volatility.
Last week, corn prices were down about 30¢, while soybeans dropped $1.40/bu.
For the week ending Sept. 23, according to the National Agricultural Statistics Service:
Corn – 88% is mature, 30% more than last year and 31% more than the five-year average. 39% is harvested, 27% more than last year and 26% more than the five-year average. 51% is in Poor or Very Poor condition, compared to 20% a year ago. 24% is in Good or Excellent condition, compared to 52% last year.
Soybeans – 73% are dropping leaves, which is 22% ahead of last year and 14% ahead of the five-year average. 22% is harvested, 18% more than last year and 14% ahead of the average. 35% is in Good or Excellent condition, compared to 53% a year ago. 34% is rated as Poor or Very Poor, compared to 18% last year.
Sorghum – 81% is coloring, 5% more than last year but 5% behind the five-year average. 48% is mature, 8% more than last year and 2% ahead of average. 31% is harvested, 6% more than last year and 4% ahead of average. 24% is in Good or Excellent condition, the same as last year. 50% is in Poor or Very Poor condition, compared to 45% last year.
Winter wheat – 25% is planted, 3% more than last year but 2% less than the average.
Pasture – 20% of the nation’s pasture and range is rated as Good or Excellent, 11% less than at the same time last year. 56% is rated Poor or Very Poor, 14% more than a year ago. States reporting more than 60% of pasture as Poor or Very Poor were: California (80%); Colorado (84%); Iowa (74%); Kansas (83%); Missouri (80%); Montana (74%); Nebraska (98%); Nevada (85%); New Mexico (79%); North Dakota (64%); Oklahoma (75%); South Dakota (78%); Wisconsin (66%); and Wyoming (85%).