The Grazing Manager, a computer-based, decision-support tool, helps graziers budget forage demand against forage supply by using demand days as the measure.
February 25, 2013
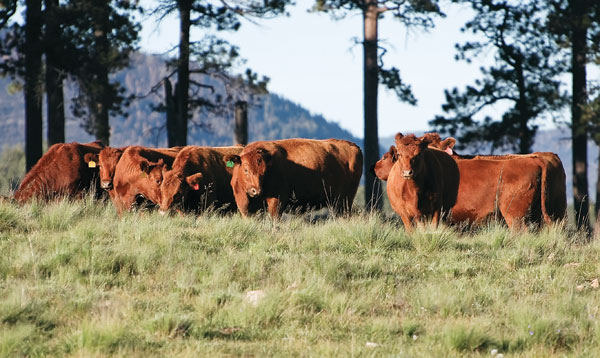
With traditional stocking rate management, annual adjustments are based on the previous year’s forage use, range conditions and trends,” says Mort Kothmann, Texas A&M University professor of range management science. “That’s like driving your car by looking in the rear-view mirror.”
Looking backwards, if a bad year follows a good one, you’re overstocked. If the opposite occurs, you’re under-stocked.
As for the historic stocking rates some use, Terry DeGroff, who owns and helms Management Information Systems in Burwell, NE, says they don’t account for how cattle size and genetics change over time.
Even when such projections mesh with reality, Kothmann explains traditional estimates of carrying capacity usually represent a static process relying on animal units (AU) as the unit of measure.
“Applying the concept of carrying capacity as a fixed stocking rate for livestock has been shown to be inadequate for sustainable management of rangelands in highly variable environments,” Kothmann explains. “Traditional approaches to analyzing stocking rates (the number of animals on a specific land area for a specified period of time) use static models and don’t explicitly consider the current year’s forage production. Grazing managers need dynamic models to project and analyze the balance between forage demand and forage production over the grazing season to determine optimum stocking rates.”
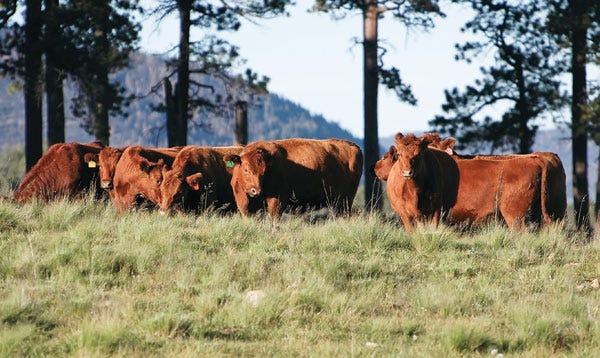
The Grazing Manager has been tested, evaluated and used by commercial ranches across the U.S. and in Mexico for more than 20 years. It’s regarded by those who use it as the best kept secret in the business.
Animal units only addresses intake
Though widely used, Kothmann points out that AU is a supply-based measurement of forage demand. By definition, it represents 26 lbs. of dry matter intake (DMI)/day, which is supposed to represent the maintenance for one cow. But the definition doesn’t say whether that’s a 900-lb., fat, dry cow or a wrung-out, 1,500-lb. mama nursing a calf. AU accounts for neither the energy demand of specific animals nor the energy provided by specific forages.
This imprecision coupled with the challenges cited above led Kothmann to begin considering the puzzle from the opposite direction back in the 1980s. Ultimately, he developed a model for managing carrying capacity that utilizes grazing demand days (DD) as the unit of measure.
Whereas AU represents DMI regardless of forage nutrient value, DeGroff explains DD also approximates the energy requirements for gain.
As the term implies, rather than a supply-based yardstick such as AU represents, DD expresses the calories demanded by livestock – cattle and other large ruminants – for both maintenance and gain. Specifically, one DD equals 12 mega calories of intake for maintenance and gain.
Kothmann wanted more than a different yardstick, though. He wanted a way to estimate forage availability, demand and use in such a way that he could detect shortfalls further down the road rather than too late or after the fact.
Applicable to all operations
Kothmann’s answer is The Grazing Manager (TGM), a computer-based, decision-support tool that budgets forage demand against forage supply using DD as the measure.
“It allows the manager to forecast forage balance many months into the future, make timely adjustments to stock numbers, and avoid risks associated with overstocking during drought,” Kothmann explains. It empowers grazing managers to be proactive rather than reactive.
While this article is slanted toward rangeland, Kothmann emphasizes TGM can be utilized with any forage and grazing system.
“TGM was developed to capture the basic elements of the intuitive management approach used by many successful grazing managers and structure them into a quantitative dynamic grazing model,” Kothmann says.
Before your eyes start to glaze over, yes, the system requires input, but nothing more than what’s already rattling around your brain. Think here in terms of the number grazing, for how long, weights on and off pasture, etc.
The variables that must be input, all of which are observable, include:
Forage year,
Seasonal forage growth cycle,
Pasture production in DD,
Annual livestock flow,
Management plan for grazing, burning, haying and supplementation,
Actual forage growth rates (estimated by the manager) and
Pasture use rating (% DD used).
The software leads users through the process and contains the necessary data, such as forage growth cycle information for wherever you operate, besides doing the calculations automatically.
Much of the TGM output is graphical, too, such as a continuum between light and heavy pasture use.
“The input doesn’t have to be exact,” Kothmann says. “You say what the range or pasture should look like based on the estimates you input. If it doesn’t, then you review your estimates until TGM and your observations agree.”
DeGroff adds that, “When there is a deficit in moisture, you can put a percentage to it – above or below normal – and approximate the reduction in forage production based on the growth curve for that specific forage in your area.”
In other words, relative to current growing conditions, based on the season forage growth cycle, TGM estimates available DD for the forage year. As growing conditions change and producers input an adjustment to reflect the change, TGM adjusts available DD for the remainder of the forage year.
Such monitoring and adjusting, especially early on, is part of what is termed calibration; calibrating you and how you use the system rather than calibrating the model.
By design, TGM doesn’t tell users what they should and shouldn’t do. It’s merely a tool offering them more precise projections to use in making decisions, Kothmann and DeGroff say.
TGM in action
In the Nebraska Sandhills, for instance, DeGroff explains the forage growth year runs May 1 to April 30. The rainfall year runs Oct. 1 to Sept. 30. By inputting the subpar moisture that clients received last fall, they could begin making adjustments to planned stocking rates for this spring and summer.
“Two months into the forage year, you can begin to project the number of demand days 10 months out,” Kothmann says.
For example, knowing how much of an effect short summer moisture will have on DD next winter means having enough time to adjust to it, be it destocking cows or weaning calves two months early.
“It allows you to make decisions very early and have confidence those adjustments will work,” DeGroff says. “What we’re looking for are early warning signals.”
In DeGroff’s part of the world last summer, on similar forage resources, yearlings were gaining 1.5 lbs./day at one place, and 2.3 lbs. /day at another. The difference was stocking rate. “With TGM, you can calibrate demand days to what your objectives are,” he says.
“The biggest mistake I see some managers make with carrying capacity is unfounded optimism,” Kothmann says. “TGM is designed to take the gamble out of running livestock on a forage resource so that you never have too many cattle for the available forage.”
Getting started
Agren, Inc. of Carroll, IA received a grant from USDA’s Risk Management Agency in 2004 to identify and develop software to help ranchers make better decisions and avoid drought risks. After a nationwide review of possible programs, they selected TGM as the most appropriate program and entered into a partnership with Texas A&M University to develop, test and promote TGM as a tool to help producers manage around drought. You can download TGM at www.thegrazingmanager.com.
TGM has been tested, evaluated and used by commercial ranches across the U.S. and in Mexico for more than 20 years. TGM is regarded by those who use it as the best kept secret in the business.
Producers can start with TGM during drought, in times of plenty or anywhere in between. Once initiated, Kothmann and DeGroff say it will take 2-4 years for producers to see its full effectiveness due to the requisite calibration mentioned earlier.
“TGM will give you sound data, but it’s not a quickie,” Kothmann says. “To calibrate TGM, pasture demand ratios (PDR) generated by TGM are compared to observed PDR values.”
According to DeGroff, the major stumbling block he encounters with producers first learning about the model is the use of DD rather than AU. If you currently think in terms of AU, he says you can use the same number as DD to get started.
Incidentally, DeGroff encourages producers to download and study the TGM Users Guide at the TGM website. It simplifies what may seem complicated otherwise.
“Ranchers adapt to this concept much easier than range scientists,” Kothmann says. “Range scientists think in terms of forage supply and they want to measure it. Ranchers, though, already think in terms of cattle demand relative to available forage.”
Unfortunately, even when it makes sense, Kothmann says more people talk about managing carrying capacity more effectively than taking the steps to do it.
“There are a few excellent managers out there, maybe 5%,” Kothmann says. “And there are a chunk of producers, 40-50%, who are pretty good managers by the seat of their pants, retrospectively. But that’s reactive.”
About the Author(s)
You May Also Like


.png?width=300&auto=webp&quality=80&disable=upscale)
