Livestock Outlook: Aim to be the best manager of costs and a better marketer of your products.
December 19, 2019
Turning a profit in beef production takes two specific management functions. One is finding an appropriate mix of farm-raised and purchased inputs to produce beef efficiently. The second is developing a marketing program to optimize revenue, and therefore profit.
Many producers may believe lowering costs automatically improves profit. Lowering costs and maintaining, or improving, revenue will boost profit. However, some cost cutting moves may erode production or quality, resulting in lower revenue and less profit.
Cost is only part of profit. Instead of focusing on becoming a low-cost producer, I challenge you to think about being the best manager of costs and a better marketer of your products. That is the calves, feeder cattle, fed cattle and even cull cows that you sell. This may require a shift in where you are spending money or increasing an expense.
How much input to use
Understand that inputs have diminishing returns. The concept is simple. At some point, each additional unit of input will produce less with less additional output. An example is applying fertilizer to a crop. You want to apply an appropriate amount of fertilizer to get an optimal yield. Not enough fertilizer results in below-optimum yields. Applying too much fertilizer can cut profit by adding cost with no additional yield to pay for it. Finding the right balance requires an evaluation of where the diminishing returns lie.
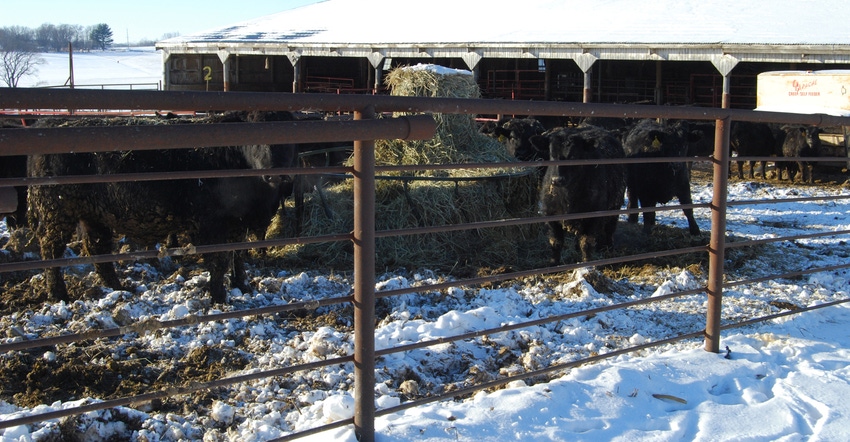
This principle also applies in beef production. Winter-feeding cows is as an example. The quantity and quality of hay provided to beef cows can influence the pounds of calves produced. Meeting the nutrient recommendations gives you an optimal size of feeder calf to sell. The optimal feeder calf size will be different for each operation.
Winter underfeeding (quality and/or quantity) of cows can result in lower conception rates or weak calves leading to a lower number of pounds weaned per cow exposed. Winter overfeeding of beef cows can result in overconditioned cows that can reduce reproductive performance and milk production and lower weaning weights.
Understanding these examples is easy. But employing this principle is much more difficult. First, producers don’t know the end-product price at the time they need to make decisions on inputs. Second, numerous biological factors influence these outcomes. However, producers should constantly be making these assessments as they manage operating expenses.
Gather and use information
To succeed, producers need to find ways to profit in the constantly changing beef cattle production environment. Measuring and recording input-output relationships that help drive profit is one key, but doing so takes time. However, generating and interpreting those data enables you to make the best management decisions possible. The old saying is true: “You can’t manage what you don’t measure.”
Producers cannot control some factors. Still, understanding where costs are occurring and interactions among costs and production practices is critical. Many producers feel that they can’t tighten their belts anymore, so the logical option is to improve profitability through increasing revenue. Now is the time to be an effective recordkeeper, which will allow you to manage your operation’s cost.
Average expenses deceiving
Farm production expenditures in Iowa were $25.3 billion in 2018, down from $26.4 billion in 2017, according to the latest USDA National Agricultural Statistics Service Farm Production Expenditures 2018 Summary report. Twelve out of the 17 expenditure items measured by USDA declined from 2017.
Total 2018 farm production expenditures were down 4.1% compared with 2017. Lower expenses should help profits. Still, odds are every line item on your 2018 profit and loss statement is up or down more than 4% from 2017.
The four-largest expenditures in Iowa total $14.5 billion and accounted for 57.3% of total expenditures in 2018. These included feed at 16.9%; livestock, poultry and related expenses at 16.0%; rent at 14.6% and farm services at 9.9%.
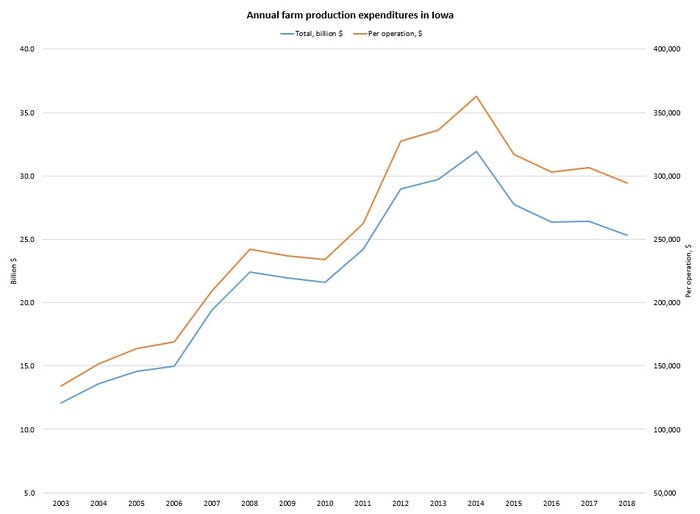
Farm production expenses easing lower in recent years can improve profit prospects, if producers can maintain revenue.

Livestock, poultry and related expenses include purchases and leasing of livestock and poultry, where intra-state and interstate transfers of livestock are captured. Rent includes cash rent paid, share rent, and public and private grazing fees. Farm services include all crop custom work, veterinary custom services, transportation costs, marketing charges, insurance, leasing of machinery and equipment, utilities, general expenses and miscellaneous business expenses.
In 2018, the Iowa total farm expenditure average per farm was $294,419, down 4% from $306,562 in 2017. On average, Iowa farm operations spent $49,651 on feed; $47,093 on livestock, poultry and related expenses; $42,907 on rent; and $29,070 on farm services. For 2017, Iowa farms spent an average of $51,103 on feed; $49,245 on livestock, poultry and related expenses; $43,206 on rent; and $30,314 on farm services.
In Iowa, the largest percentage increases from 2017 to 2018 were for fuel (up 20.0%), farm supplies and repairs (up 11.6%), taxes (up 9.8%) and interest (up 7.2%). Farm supplies and repairs include bedding and litter, marketing containers, power farm-shop equipment, oils and lubricants, temporary fencing, miscellaneous non-capital equipment and supplies, repairs and maintenance of equipment not depreciated, and other small, non-capital equipment.
Iowa’s largest percentage decreases were for farm improvements and construction (down 36.5%), trucks and autos (down 35.4%), other farm machinery (down 23.5%), and tractors and self-propelled farm machinery (down 15.4%). Farm improvements and construction include all expenditures related to new construction or repairs of buildings, fences, operator dwelling (if dwelling is owned by operation) and any improvements to physical structures of land.
Benchmarking across regions
The Midwest region, which includes Illinois, Indiana, Iowa, Michigan, Minnesota, Missouri, Ohio, Wisconsin and other Midwest states, contributed the most to U.S. total expenditures, with expenses of $104.7 billion in 2018. The Midwest accounted for 29.6% of the total U.S. farm production expenditures.
Other regions, ranked by total expenditures, were the Plains at $91.7 billion (25.9%), West at $76.2 billion (21.5%), Atlantic at $45 billion (12.7%), and South at $36.3 billion (10.3%). The Midwest decreased $3 billion, or 2.8% from 2017, the largest regional decrease. Within the Midwest region, Iowa had the highest total and average per farm production expense.
The West region, which includes California, Washington and other Western states had the highest per operation production expense at $245,487 in 2018. The Atlantic region, with North Carolina and other Atlantic states, had the lowest per operation expense at $112,366. The Midwest had an average operation expense of $184,653.
The sample for this survey meets the official USDA definition of a farm (all establishments that sold or would normally have sold at least $1,000 of agricultural products during the previous year). These operations include not only traditional agricultural farms such as grain farms and ranching operations, but also specialty farms like orchards, nurseries and aquaculture. This helps explain why the West region has the highest production expense per operation.
The principal expenses for livestock farms are feed costs, purchases of feeder animals and poultry, and hired labor. Projected changes to principal livestock expenses in 2019 were mixed according to USDA’s Economic Research Service. Feed costs and hired labor were estimated to be larger than in 2018, while replacement animal costs and interest costs were lower.
Livestock values drive profit prospects
So far in 2019, Iowa calf and feeder cattle prices were 6% and 3%, respectively, below 2018 values. Feeder cattle futures prices suggest higher prices in 2020.
Many expect feed prices to remain relatively low for the next couple of years, pending a major weather impact. Given recent relative stability in feed costs, net return projections for 2020 are primarily driven by animal market values.
Expected feed cost changes vary by type. For 2019, the average rental rate for Iowa pastures was $59 per acre, according to USDA’s cash rent survey. This is a record, up $5 from 2018. But pasture rents have likely reached a plateau. The average sales value of Iowa pastureland was $2,720 per acre, down $70 from 2018, according to USDA’s agricultural land values survey.
Iowa hay (excluding alfalfa) prices averaged $118.50 per ton through the first 10 months of 2019, about $10 higher than 2018. However, hay prices have averaged $10 per ton lower in September and October, a differential that could continue into 2020 with higher estimated stock levels.
In December, USDA’s World Agricultural Outlook Board pegged the 2018-19 marketing-year weighted average corn price received by farmers at $3.61 per bushel, up 7% from 2017-18. USDA forecasts corn prices to rise another 7% in the 2019-20 market year to $3.85 per bushel.
Schulz is the Iowa State University Extension livestock economist. Email [email protected].
About the Author(s)
You May Also Like


