Farm Progress America, May 3, 2024
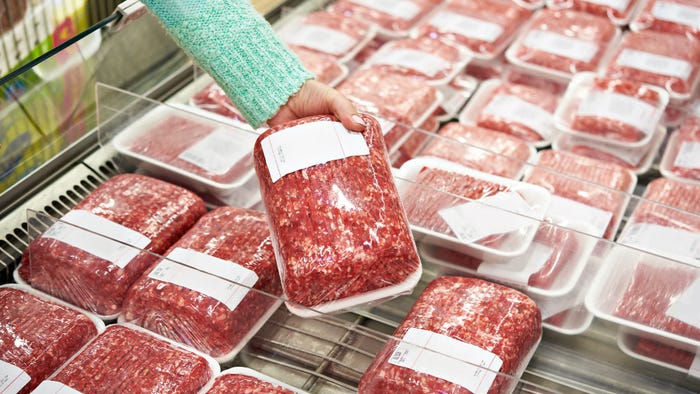
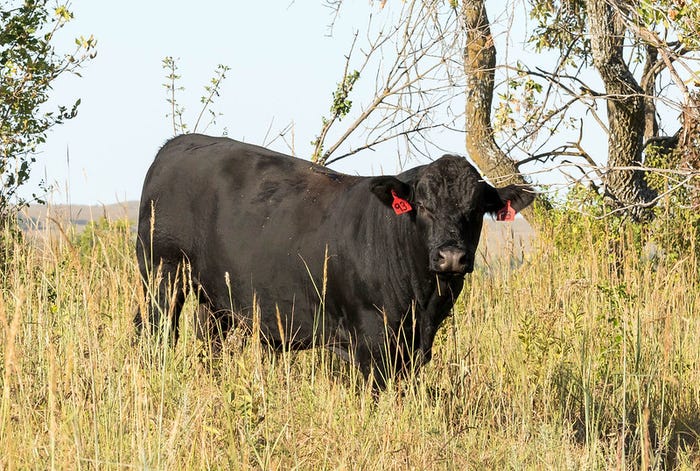
Cattle HealthFarm Progress America, May 3, 2024Farm Progress America, May 3, 2024
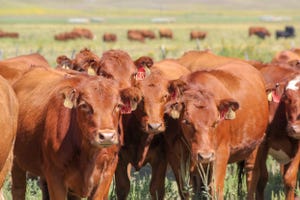
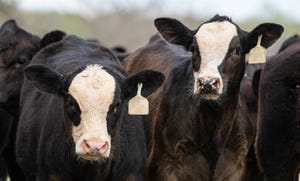
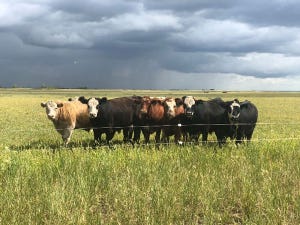
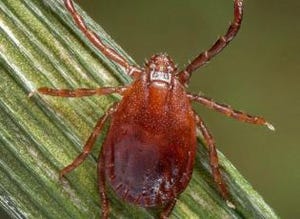
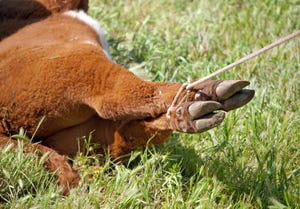
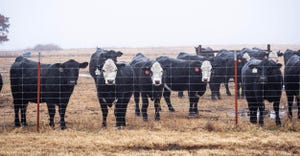
Mike Pearson reminds listeners to be on the look out for the Asian Longhorn tick as the weather turns warmer.


.jpg?width=300&auto=webp&quality=80&disable=upscale)

.png?width=300&auto=webp&quality=80&disable=upscale)


Recent Headlines


Enter a zip code to see the weather conditions for a different location.

Aug 27 - Aug 29, 2024
Aug 27 - Aug 29, 2024
Farm Progress Show annually hosts more than 600 exhibitors displaying new farm equipment, tractors, combines and farm implements; seed and crop protection products; and many additional farm supplies and services.
LEARN MORESubscribe to Our Newsletters
BEEF Magazine is the source for beef production, management and market news.