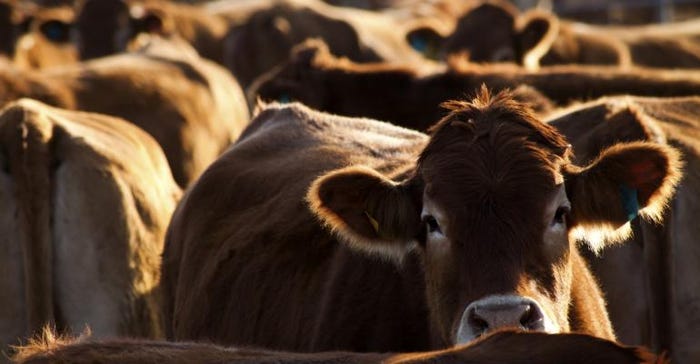
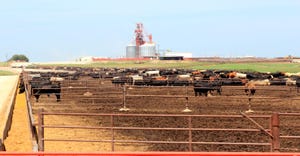
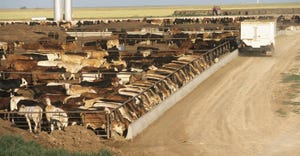
Cattle Market Outlook
thumbnail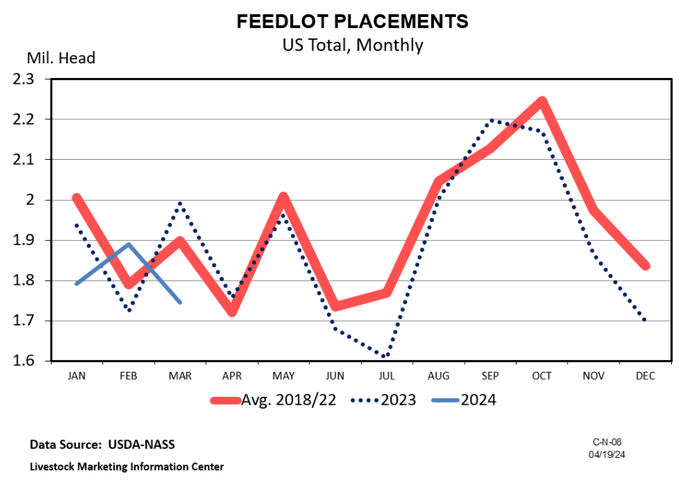
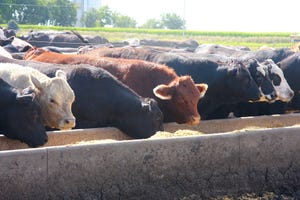
Cattle Market OutlookA bullish April cattle on feed reportA bullish April cattle on feed report
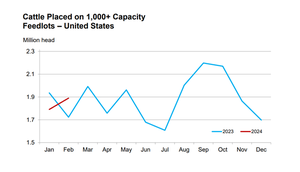
The April Cattle on Feed report highlighted a notable decrease in March placements compared to the same period in 2023.


Recent Headlines

Enter a zip code to see the weather conditions for a different location.

Aug 27 - Aug 29, 2024
Aug 27 - Aug 29, 2024
Farm Progress Show annually hosts more than 600 exhibitors displaying new farm equipment, tractors, combines and farm implements; seed and crop protection products; and many additional farm supplies and services.
LEARN MORESubscribe to Our Newsletters
BEEF Magazine is the source for beef production, management and market news.