Analysis of online media, U.S. production and cold storage data do not support narrative that system broke, but was strained and responded efficiently.
August 24, 2022

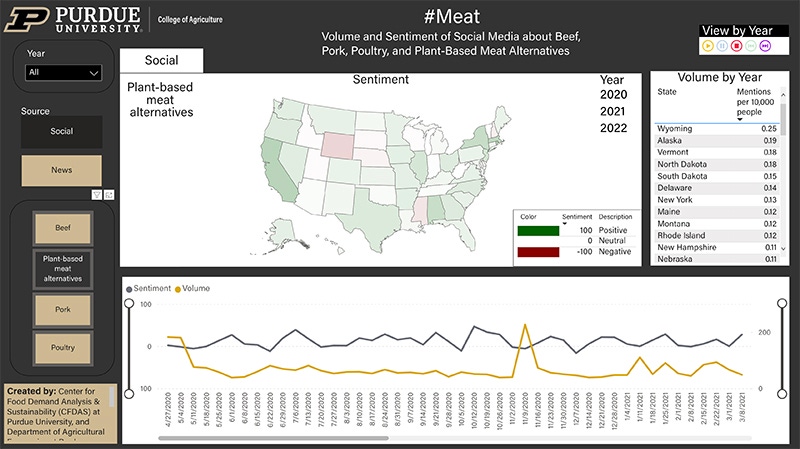
Purdue University's Center for Food Demand Analysis and Sustainability has added a meat sentiment dashboard to its roster of free-access food system dashboards. The new dashboard, updated weekly, shows the sentiment and volume of meat and meat alternative mentions in social media and online news.
Users may explore the sentiment and volume of #Meat mentions in all 50 states individually for social media or the entire country in a narrowly or broadly defined time range starting with April 2020 in online news and social media.
"The general perception is more positive than what the average person might guess," says Nicole Olynk Widmar, professor and associate head of agricultural economics at Purdue. During the height of the COVID-19 pandemic, for example, shoppers may have been unhappy with meat availability. Meat was available, but not always exactly what shoppers wanted, when and where they wanted it.
"Perception is going to reflect a few key headlines that may or may not have correctly reflected the state of the industry. This dashboard gives you a chance to look more holistically across the different products," she says.
The dashboard's color-coded sentiment gradient ranges from dark green for 100% positive to dark red for 100% negative. On social media in Indiana from April 2020 to July 2022, for example, poultry had a net sentiment of 49.30, followed by beef at 39.72 and pork at 37.30. Plant-based meat alternatives, meanwhile, rated a barely positive net sentiment at 3.20. The volume of relevant daily posts during this period ranged from a high of 2,955 to a low of 1,485.
In the news nationwide for the same time period, poultry (3 million posts) and pork (2 million posts) both had net sentiments of 32. Beef came out with a positive net sentiment of 29 over 1 million posts. Plant-based meat alternatives had a net sentiment of 26 over 387,000 posts.
Individual companies in various industries have a profit motive to privately collect and analyze data relevant to the demand for their own products. But when it comes to big data and agriculture, "It's just sitting there and not being used as well as it could be," Widmar says.
Widmar discussed using social media analytics to better understand how people perceive food products such as milk and eggs, among other issues, at Purdue's "Dawn or Doom 2018" conference. In 2019, she published an article on the insights that big data provides into public perception of the USDA. In 2020, Widmar and Courtney Bir of Oklahoma State University noted the various ways of using public data for the public good.
And in 2021, Widmar and four co-authors published another article, on "The anatomy of natural disasters on online media: hurricanes and wildfires," in the journal Natural Hazards. The article describes how watching data flow in response to natural disasters can help government organizations identify who needs help when shortages truly occur.
The dashboard is a collaboration between Widmar and Jayson Lusk, the head and Distinguished Professor of Agricultural Economics at Purdue, who leads the CDFAS. They conceived the meat dashboard idea following meat-market disruptions during the COVID-19 pandemic that spurred news headlines of a broken U.S. food system. Widmar and Lusk serve as co-authors of the dashboard, along with CFDAS postdoctoral research associate Jinho Jung and research data analyst and visualization specialist Annapurni Subramaniam.
CFDAS collected the data in collaboration with NetBase Quid through its Intelligence Connector tool. An article published in the July 2022 issue of the journal Meat Science details the data-gathering methods used.
The meat sentiment dashboard brings to seven the number of dashboards in the "Supply and Production" category. Also available are two price dashboards and two consumer spending dashboards.
The methods include writing the search algorithms to exclude references to "Peppa" or "Porky" the cartoon pigs in the search for traffic about food pork, for example. Or calling someone "a chicken" or saying that someone has "a beef" with another person instead of talking about meat for eating.
The recent Meat Science article analyzed the "Perception versus reality of the COVID-19 pandemic in U.S. meat markets." In that article, Widmar and three co-authors noted wrote that "analysis of online media and U.S. production and cold storage data do not support the narrative that the system 'broke,' but was perhaps 'strained' and 'responded efficiently.'"
Widmar and Lusk decided that as a land-grant university, Purdue could make online and social media data related to agriculture readily available for other people to ask related questions.
"That's why the dashboard is interesting beyond some of the research that we've been able to publish," Widmar says.
Widmar cautioned dashboard users to remember the social media world is messy.
"Anybody can put information out there, so it has caveats," she says. "Just because information is out there doesn't mean it was right. It really was out there; it's what people saw. But that doesn't mean what they saw was 100% accurate."
Source: Purdue University, which is solely responsible for the information provided, and wholly owns the information. Informa Business Media and all its subsidiaries are not responsible for any of the content contained in this information asset.
You May Also Like


