What’s up with this crazy weather? Here’s a look.
April 3, 2019
By Chad McNutt
Since mid-February, we have seen an intensification of El Niño. El Niño intensifying this late in the year is somewhat unique.
The National Oceanic and Atmospheric Administration (NOAA) and other forecast groups gave us plenty of notice El Niño was coming, but how it actually evolved was a surprise.
El Niño vs La Niña
Burt first, some background.
El Niño conditions occur when warmer than average water accumulates in the central and eastern tropical Pacific Ocean. Alternatively, La Niña conditions occur when cooler than average waters accumulate in the same region of the Pacific Ocean.
Why is this important? El Niño and La Niña can shift seasonal temperature and precipitation patterns across the U.S. and around the globe. When the tropical ocean either warms or cools, it can affect pressure gradients, which can in turn change atmospheric wind patterns that can alter precipitation patterns.
For the U.S., El Niño events usually have a jet-stream that is shifted south. That can bring above-normal precipitation across the southern tier of the country, while producing less storminess and milder conditions across the northern tier.
La Niña events, on the other hand, feature a jet-stream that is shifted north over the northern U.S. and Canada. That produces colder and stormier conditions over the northern tier of the country and less precipitation and milder temperatures over the southern tier.
What’s happening now
To quickly recap, El Niño has been very slow to form, then in January it essentially went MIA, and finally, in mid-February, El Niño began its much-anticipated push. That caused NOAA to finally issue an El Niño Advisory.
Usually, by February and March, El Niño events begin winding down. Not this one. Instead, we have seen it intensify and with it, a very active storm track has brought much-needed moisture to much of the western U.S.
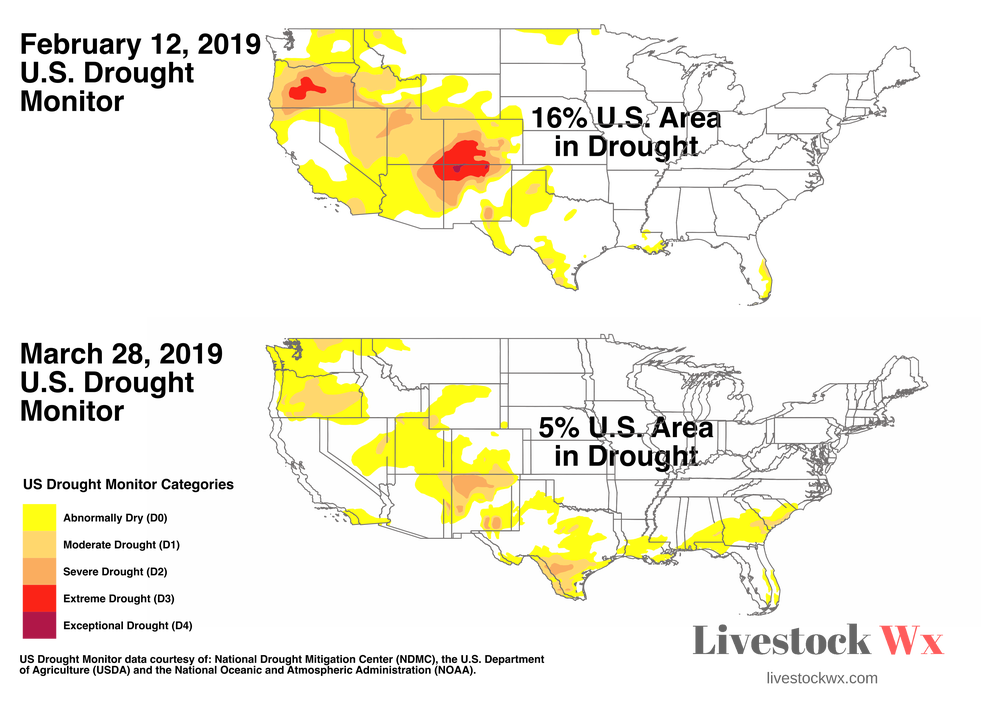
The wet conditions have reduced the area considered in drought by the U.S. Drought Monitor by over 10 percentage points over the last month (see map above).
Another way to look at the drastic change is to look at the percentage of the major cattle, corn, and hay-producing areas that are in drought. At present, 2% of cattle and 2% of hay are in drought and no major corn growing area is in drought. These are the lowest percentages since the three stats started to be tracked by USDA in 2011.
Los Niños?
According to Klaus Wolter, retired researcher at the University of Colorado who specializes on El Niño and La Niño events, “While most El Niño events tend to persist through winter and weaken into spring, they can get a late boost during the winter, with the most recent examples being the weak El Niño of 2014-15 that morphed into the Super Niño of 2015-16, and the weak El Niño of 2004-05 that had a late rally in early 2005, but then dissipated by mid-2005.”
Wolter said that going forward, “The majority of the ECMWF [European Centre for Medium-Range Weather Forecasts] model runs show moderate El Niño conditions during early summer, followed by greater uncertainty in the fall.”
Wolter said even though there is uncertainty in the fall timeframe there is still increased odds of a second El Niño winter (aka the rare Los Niños or the double-dip El Niño) given that the majority of climate models show El Niño conditions into early 2020.
Wolter described that while two-year El Niño events are not quite as common as “double-dip” La Niña events (i.e. two or more years of La Niña), they have occurred six times since 1948: 2014-16, 1991-93, 1986-88, 76-78, 68-70, and 1957-59.
“As best as we can tell, the late spring season (April-June) during such conditions tend to be similar to typical El Niño springs, with much cooler-than-average temperatures most likely in the Southern Plains and much warmer-than-average temperatures in the northwestern U.S.,” Wolter said.
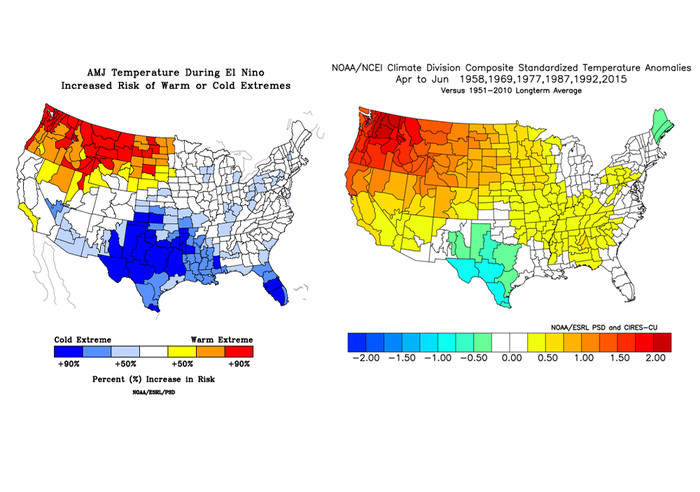
The above maps show the risk of warm or cold extremes (left map) during April-May-June of El Niño, compared to the average outcome during the first-year spring of a two-year El Niño (right map). Essentially, what Wolter is saying is that it does not make much of a difference for spring, whether you consider all El Niño events, or just the ones that persisted into the following year.
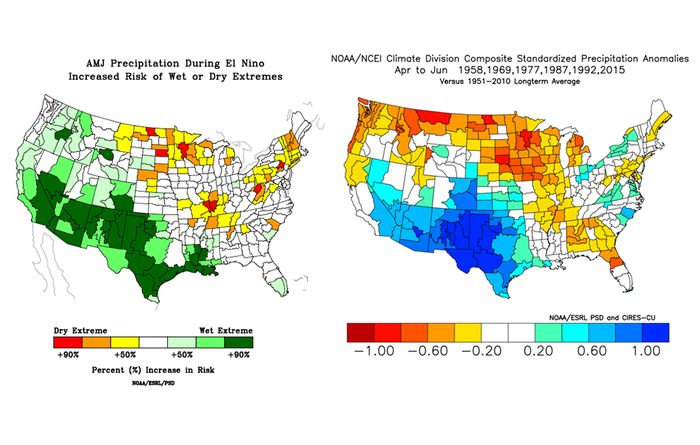
For precipitation, the general risk (left map above) of being in the wettest 20% of the observed springs during 1895-2014 is highest from southern California along the Mexican border and continuing to Louisiana during El Niño springs. The risk of ending up in the driest 20% is highest over the Northern Plains and Midwest, which is consistent with what we would normally expect for an El Niño.
The take home from all this is that El Niño is currently solidifying and will favor a wet and cool spring in much of the U.S (see the latest NOAA Seasonal Outlooks). If it continues to strengthen into the summer, the odds for a second El Niño winter in 2019-20 are better than 50%.
This story was adapted from an article on livestockwx.com. McNutt is the co-founder of Livestock Wx and editor of the Livestock Weather Journal.
You May Also Like


