thumbnail
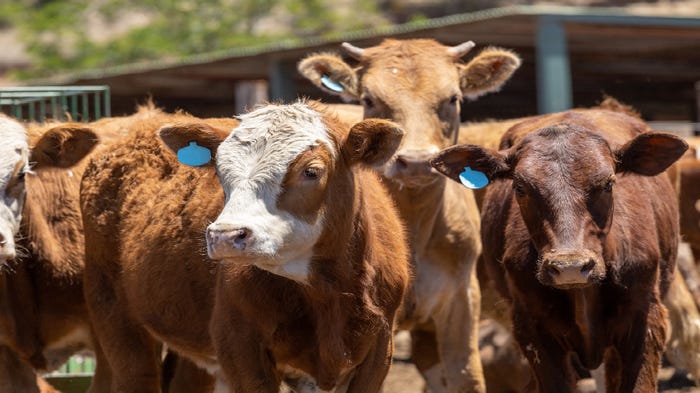
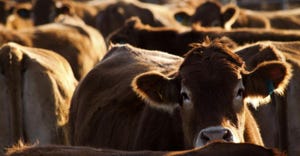
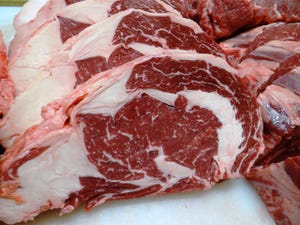
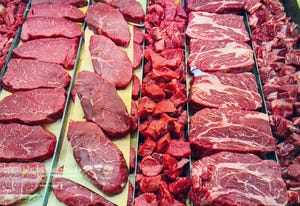
Market newsU.S. beef, cattle demand posts early 2024 highsU.S. beef, cattle demand posts early 2024 highs
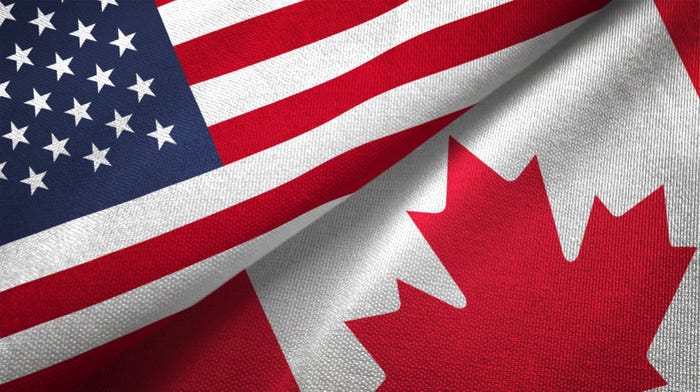
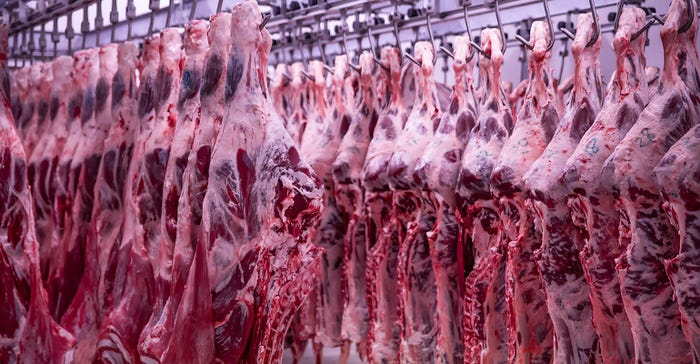
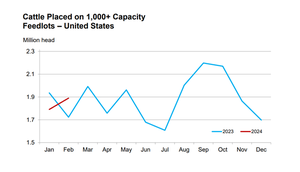
Trade deficit continues to widen as beef production declines.

byAnn Hess

.jpg?width=300&auto=webp&quality=80&disable=upscale)


Recent Headlines


Enter a zip code to see the weather conditions for a different location.

Aug 27 - Aug 29, 2024
Aug 27 - Aug 29, 2024
Farm Progress Show annually hosts more than 600 exhibitors displaying new farm equipment, tractors, combines and farm implements; seed and crop protection products; and many additional farm supplies and services.
LEARN MORESubscribe to Our Newsletters
BEEF Magazine is the source for beef production, management and market news.