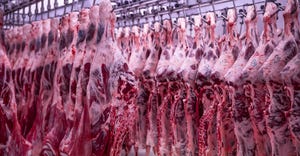
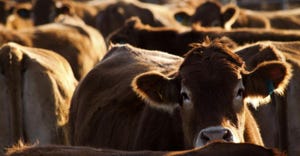
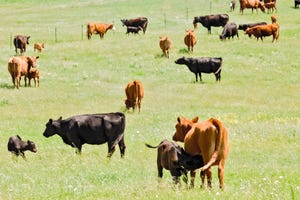
Beef Magazine is part of the Informa Markets Division of Informa PLC

This site is operated by a business or businesses owned by Informa PLC and all copyright resides with them. Informa PLC's registered office is 5 Howick Place, London SW1P 1WG. Registered in England and Wales. Number 8860726.

Despite Record Prices, Push The Pencil For The Best Selling Option

Despite Record Prices, Push The Pencil For The Best Selling Option

These are exciting times in the cattle business, and every rancher wants to take advantage of record prices. Even with these great prices, you should be sure to use a sharp pencil as you make your post-weaning marketing plans for 2013 calves.

The lightweight market is presumably being driven by demand for stocker cattle for wheat and southern grazing. Figure 1 below summarizes the record sale-barn prices that eastern Wyoming and western Nebraska recorded for mid-January 2014. My statistical analysis shows that 550-lb. steer calves averaged $220/cwt., and that 800-lb. steers averaged $171/cwt.

Figure 2 depicts my statistical analysis of mid-January feeder calf prices. The red line is the mid-January 2014 price line, and the yellow line is for mid-January 2013. Clearly, 2014 demand for lightweight feeders is stronger.


The slope of the price line at any given market price is the statistical price slide for feeder steers in that particular market. For example, the slide for 550-lb. feeders was a minus $24.73, and a minus $14.03 for 800-lb. feeder steers. Both are very high.


The increased slope of the 2014 price line compared to the 2013 price line suggests a bigger price slide in January 2014 than in January 2013. That, in turn, suggests cattlemen could be dealing with larger negative buy/sell margins when trying to market 2013 calves post-weaning.


Any discussion about cattle marketing has to include corn prices. Figure 3 illustrates the corn-price volatility since 2006. The straight line is the trend line for corn prices from December 2002 through December 2016. Figure 3 clearly suggests that corn prices are projected below trend for the marketing of 2013-born cattle.


The current futures market suggests 2014 corn prices in the $4.25-$5 range. I have cattle finished in mid-January 2014 charged with $5.09/bu. corn, and 2013 calves grown and finished in May 2014 charged with $4.25/bu. corn. Meanwhile, in January 2013 slaughter cattle marketings, I had calves grown and finished with $6.77 corn — what a difference a year makes.


Each month, I project cattle prices for five critical marketing periods in the calendar year (Figure 4). The bottom two lines present my slaughter-cattle price projections, which are based on futures prices adjusted by eastern Wyoming/western Nebraska basis calculations.


As part of this monthly price analysis, I try to project the profits from harvesting slaughter cattle in the current midmonth — in this month’s case, harvesting mid-January 2014. These steers were assumed put on feed in July 2013 at a cost of $148/cwt. They were harvested in January 2014 at $134/cwt., generating a minus $14 buy/sell margin — a very low buy/sell margin. Figure 5 summarizes this marketing alternative.


The left side of Figure 5 shows the breakeven cost of gain (COG) at $1.15/lb. Meanwhile, the right side evaluates the projected profit for alternative COG and alternative buy/sell margins. Actual projected COG for finishing these animals was 88¢/lb., but there is no 88¢ column in that table. So how do I extrapolate this table to fit an 88¢ COG?


All relationships in this table are linear, making it easy to adjust the tabled values for the 88¢ COG. Each column represents a 15¢ change in COG. Holding the buy/sell margin constant at the minus $14 value, each column to the left of the zero center increases by $82.50.

The 88¢ COG is 80% (12¢/15¢ = 0.8, or 80%) of the way between the first and second columns to the left of the zeroes. Thus, we need to add (80% of the $82.50 = $66) to the left column’s $82.50 for a total of $148 ($82.50 +$66 = $148.50, rounded to $148) profit/head. The calculated profit at the bottom of the table is also $148/ head.


The highest profit

This is the highest profit I’ve calculated for finishing cattle in a long time. These cattle were considered marketed in January 2014. When feedlot operators make high profits, they tend to reinvest the money into replacement feeder cattle. As a result, we should see some good demand for feeder cattle this spring.


Now you should be able to use Figure 5 with your own buy/sell numbers and your own projected COG to project your profit from finishing your 2013 calves.


Let's turn to grass cattle and look at buying 600-lb. steers on grass in late April or early May 2014. Based on Figure 4, the projected buy price for eastern Wyoming/western Nebraska is $208/cwt., or $1,248/head. We would graze these calves until September 2014 and sell them off grass at 800 lbs. for a projected $167/cwt., or $1,336/head. The projected average daily gain is 1.5 lbs./day. Figure 6 summarizes the economic projections of this proposed marketing alternative.


The left-hand side of Figure 6 presents the economic evaluation. The calculated buy/sell margin comes to a minus $41, for a projected $246 marketing loss on the original 600 lbs. The breakeven COG on grass calculates out to 44¢/lb. gained.


The bottom section on the right side of Figure 6 presents my calculated profit per head based on my projected 55¢/lb. COG on grass, which I based on an $18.75 monthly grazing cost/steer, plus salt and mineral. My projected profit is a minus $22/steer on grass. Remember that I’ve paid the local going rental rate for grass.


You can use the right side to explore some alternative marketing scenarios for your grass cattle. Note that the $0.00 in the center of the table is based on a negative $41 buy/sell margin and the breakeven 44¢/lb. COG. The right-hand side of Figure 4 allows you to choose a different buy/sell margin and different COG on your grass. The right-hand table numbers projects the profit per head for your own buy/sell margin and your own COG.


Remember that most post-weaning marketing alternatives should include a “buy” component as well as a “sell” component. Even your own weaned calves need to be priced into your marketing alternatives. The steep price line for today’s prices leads to increased buy/sell margins that put considerable pressure on breakeven COGs.


Current corn prices lower COG, and current marketing buy/sell margins are putting upward pressure on breakeven COG. Be sure to use a sharp pencil in making your post-weaning marketing plans for your 2013 calves.


Harlan Hughes is a North Dakota State University professor emeritus. He lives in Kuna, ID. Reach him at 701-238-9607 or [email protected]


More resources for you:

Best Tips For Selecting Replacement Heifers For The Beef Herd

Exclusive BEEF Survey: Find Out Trends In U.S. Beef Cowherd Genetics Here!

Why Cattle Numbers Must Increase To Maintain Infrastructure

Hide comments
account-default-image

Comments

  • Allowed HTML tags: <em> <strong> <blockquote> <br> <p>

Plain text

  • No HTML tags allowed.
  • Web page addresses and e-mail addresses turn into links automatically.
  • Lines and paragraphs break automatically.
Publish