thumbnail
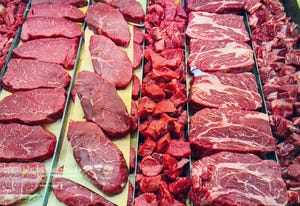
Market newsMeat Institute guidance fights child labor, identity fraudMeat Institute guidance fights child labor, identity fraud
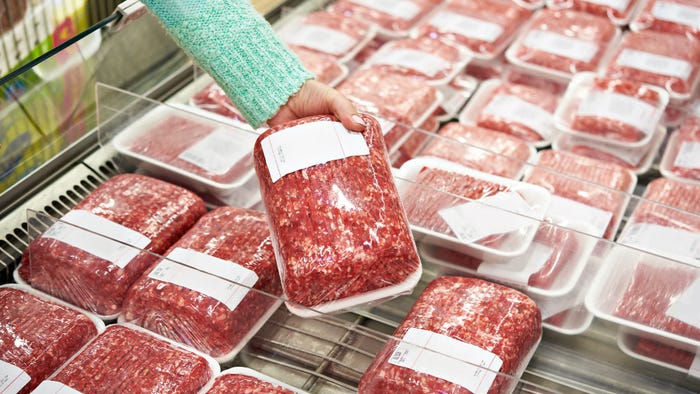
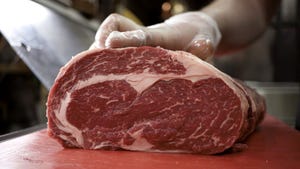
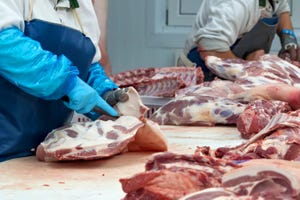
Members universally aligned that meat and poultry production facilities are no place for children.


.png?width=300&auto=webp&quality=80&disable=upscale)


.jpg?width=300&auto=webp&quality=80&disable=upscale)


Recent Headlines

Enter a zip code to see the weather conditions for a different location.

Aug 27 - Aug 29, 2024
Aug 27 - Aug 29, 2024
Farm Progress Show annually hosts more than 600 exhibitors displaying new farm equipment, tractors, combines and farm implements; seed and crop protection products; and many additional farm supplies and services.
LEARN MORESubscribe to Our Newsletters
BEEF Magazine is the source for beef production, management and market news.