Beef demand is the difference maker
While not perfect, cow inventory is the best reflection of relative change in the overall size of the beef herd from year to year.
June 25, 2020

Industry At A Glance previously outlined the influence of cattle imports on the fed cattle market during the past 10 years. In short, cattle imports have no influence on the direction of the fed market on a year-over-year basis. Differences in import numbers simply aren’t big enough to move the market – they’re buffered by a vastly larger domestic supply.
The column noted, “…that could change if imported numbers were to suddenly surge or decline beyond what’s occurred during the past 10 years. But for time being, given the limited variation in number of cattle being imported, changes in domestic cattle supply and subsequent beef production are far more significant in establishing general direction of the fed cattle market.”
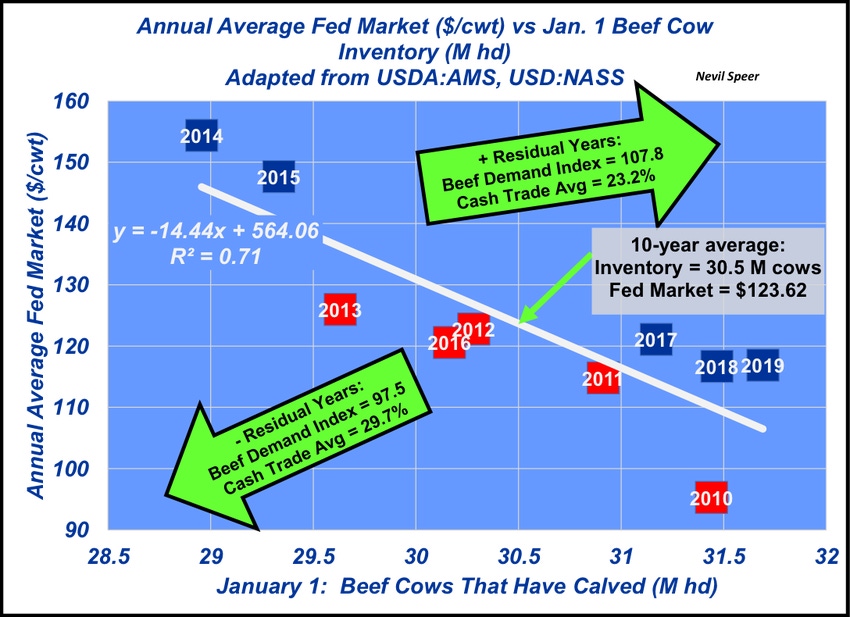
With that in mind, it’s useful to address the domestic cattle supply and its influence on the fed market. This week’s graph details the relationship between the January 1 beef cow inventory and the annual averaged fed market during the past 10 years. Not surprisingly, the correlation between beef cow inventory and the fed market is strong (-.84).

At first blush, it’s counter-intuitive to consider this year’s starting beef cow inventory on the fed market. After all, this year’s calves won’t be harvested until the following year.
However, the January 1 cow inventory is last year’s inventory being carried into the new year. Moreover, the measure reflects cows that have calved. Therefore, it’s a rough indicator of last year’s beef calf crop, with some give and take for liquidation, lost calves, cows that never calve, etc. Calves born last year, with some exceptions, will mostly be harvested over the course of the current year. Cow inventory isn’t perfect, but it’s the best reflection of relative change in the overall size of the beef herd from year-to-year.
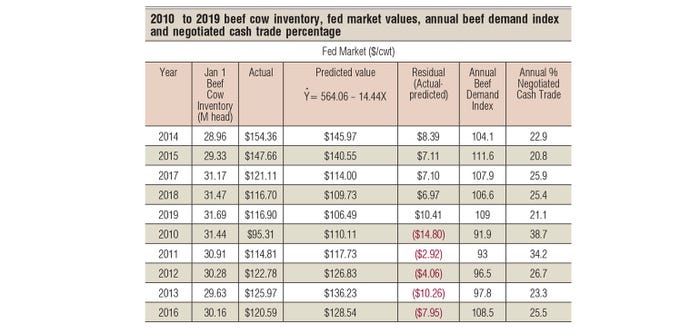
The fed market averaged roughly $124 per cwt between 2010 and 2019 against an average beef cow inventory of 30.5 million head. But within that broad overview there exist some key take-aways that are important. That’s especially true when considering positive-residual years (’14,’15,’17-’19) versus negative-residual years (’10-’13, ’16) – that is, years above the regression line versus those below. A table of the breakdown is provided below:

Key take-aways:
Considering residuals from the regression line, the general trend with respect to time speaks to broader market strength. After accounting for beef cow inventory, the market has been stronger during the back-half of the decade versus the front-half. In other words, the relative direction of residuals (actual minus expected) has been mostly positive during the past five years, the only exception being 2016 when the market was burdened by large carryover through much of the year.
That time trend invokes consideration of beef demand: the beef demand index averaged 107.8 in the positive residual years versus only 97.5 in the negative residual years. Demand makes a difference when it comes to sorting differences of inventory and price: better demand means better prices. Improved beef quality and consistency, in conjunction with ongoing education, research and promotion by the Beef Checkoff, is paying dividends over time.
Turning attention to the negotiated cash trade and its influence on the fed market, the negative residual years nearly match provisions contained within the 30/14 proposal. Meanwhile, the positive residual years – i.e. stronger prices – occurred with an average of only 23% negotiated cash trade.
MCOOL proponents often point to 2014 and 2015 in terms of market performance – arguing stronger prices were the direct result of mandatory labeling laws. However, after accounting for beef cow inventory (supply), market residuals in ’14 and ’15 aren’t substantively different compared to the other positive residual years (’17, ’18 and ’19). In other words, there’s no evidence MCOOL provided any extra ordinary boost to the market.
These factors most meaningfully converge when comparing 2010 versus 2018. Beef cow inventories were nearly equal across the two years—31.44 vs. 31.47 million head, respectively. The fed market average in 2018 was $21 per cwt stronger versus 2010!
How is it possible that 2018 could be so much better? Beef demand is the difference maker – the index in 2018 was nearly 15 points stronger versus 2010, again underscoring the importance of improved beef quality and efforts by the Beef Checkoff.
Meanwhile, also significant amidst ongoing industry discussion around the market: the percentage of cash trade in 2010 was the highest in the series and more than 13 points higher versus 2018 (38.7% vs 25.4%, respectively) – yet 2010 also held the largest underperforming residual value during the past 10 years. Leave your thoughts in the comments section below.
Nevil Speer is based in Bowling Green, Ky. and serves as director of industry relations for Where Food Comes From (WFCF). The views and opinions expressed herein do not necessarily reflect those of WFCF or its shareholders. He can be reached at [email protected]. The opinions of the author are not necessarily those of beefmagazine.com or Farm Progress.
About the Author(s)
You May Also Like


