Ag workers: Few and mighty
Finding solutions to the growing rural workforce shortage requires understanding the current reality. Second in a series.
September 18, 2019

Never have so few produced so much agricultural bounty.
“Agriculture, food, and related industries contributed $1.053 trillion to U.S. gross domestic product (GDP) in 2017, a 5.4% share,” according to USDA’s Economic Research Service (ERS). “The output of America’s farms contributed $132.8 billion of this sum — about 1% of GDP.”
The overall contribution of the agriculture sector to GDP is larger than this, because sectors related to agriculture — forestry, fishing and related activities; food, beverages and tobacco products; textiles, apparel and leather products; food and beverage stores; and food service, eating and drinking places — rely on agricultural inputs in order to contribute added value to the economy, ERS adds.
In fact, the 2019 Food and Agriculture Industries Economic Impact Study estimates the number of jobs in food and agriculture-related industries at 45.8 million, and the economic impact of the total food industry at $7.06 trillion.
For the purpose of the study, the food industry includes any businesses involved in food agriculture, food manufacturing, food wholesaling or food retailing. To measure the total economic impact of the sectors, the analysis includes the indirect and induced economic activity surrounding these industries, which captures upstream and downstream activity.
For example, when a farm equipment retailer hires new employees because farmers are buying more tractors, experts consider the new salaries as an indirect impact. Similarly, when a retail associate spends her paycheck, an induced economic impact occurs. Together, these impacts have a multiplier effect on the already formidable direct impact of food and agriculture.
Direct on-farm employment in 2017 accounted for approximately 2.6 million jobs, or 1.3% of U.S. employment, according to ERS. Employment in industries related to the agriculture and food industries supported another 19 million jobs. All told, 21.6 million full-time and part-time jobs in the U.S. — 11% of total U.S. employment — were related to the agriculture and food sectors.
Self-employed ranch operators and their family members continued to represent the lion’s share of on-farm labor through the turn of the century, but hired labor was growing at a faster rate.
“Both types of employment have been in long-term decline, as rising agricultural productivity due to mechanization has reduced the need for labor,” ERS analysts say. “According to data from the National Agricultural Statistical Service’s Farm Labor Survey (FLS), the number of self-employed and family farmworkers declined from 7.60 million in 1950 to 2.06 million in 2000, a 73% reduction.
“Over this period, average annual employment of hired farmworkers — including on-farm support personnel and those who work for farm labor contractors — declined from 2.33 million to 1.13 million, a 52% reduction. As a result, the proportion of hired workers has increased over time.”
More recently, the hired worker and contract worker share of agricultural labor increased from 25.3% in 2003 to 41% in 2016, according to ERS analysts. They explain part of that has to do with increasing average farm size.
Aging, changing rural workforce
Along the way, rural laborers — USDA’s category of laborers, graders and sorters — are getting older on average, led by the increasing age of immigrant farmworkers. As mentioned in the first part of this BEEF series. producers are aging, too.
According to the 2017 Census of Agriculture, there were 3.4 million producers involved in decisions for the operations reported by ag census respondents. Of those, 33.94% were 65 years old or older; 11.65% were at least 75 years old.
More women are decision-makers on ranches and farms, too.
The latest ag census reports that 36.18% of the nation’s 3.4 million agricultural producers were female in 2017. Females represented 30.5% of the 3.18 million total producers reported in the 2012 Census of Ag. Another way of looking at it is that the number of female agricultural producers increased 26.6% between 2012 and 2017.
Women also make up a growing proportion of the agricultural workforce.
“The share of farmworkers who are women declined in 2007-09, from 18.7% to 17.6%, but has since climbed to 25.0% [in 2017],” according to ERS. “The fact that the female share fell during the Great Recession and has risen during the recovery is consistent with men moving into agriculture as employment in the nonfarm economy declines, and out of agriculture as nonfarm job prospects improve,” ERS analysts say.
“The rising female share is also consistent with the fact that, as labor costs rise, some growers are adopting mechanical aids (such as hydraulic platforms that replace ladders in tree-fruit harvesting, and mobile conveyor belts that reduce the distance heavy loads must be carried), which permit women and older workers to perform tasks that were traditionally performed largely by younger men.”
Incidentally, 26% of workers in crops and related support industries are female, according to ERS data, compared with 20% in livestock and related support industries.
Average wages increase
Competition for folks to work on the ranch continues to grow as the nation’s unemployment rate hovers around 4%.
“Farm operators paid their hired workers an average wage of $14.71 per hour during the April 2019 reference week, up 7% from the April 2018 reference week,” according to USDA’s semiannual Farm Labor report (FLR). “Fieldworkers received an average of $13.80 per hour, up 8%. Livestock workers earned $13.61 per hour, up 6%. The field and livestock worker combined wage rate, at $13.73 per hour, was up 8% from the 2018 reference week.”
For broader perspective, inflation-adjusted wages for directly hired farmworkers in the U.S. rose just under 1% per year between 1989 and 2017, according to FLS data summarized by ERS.
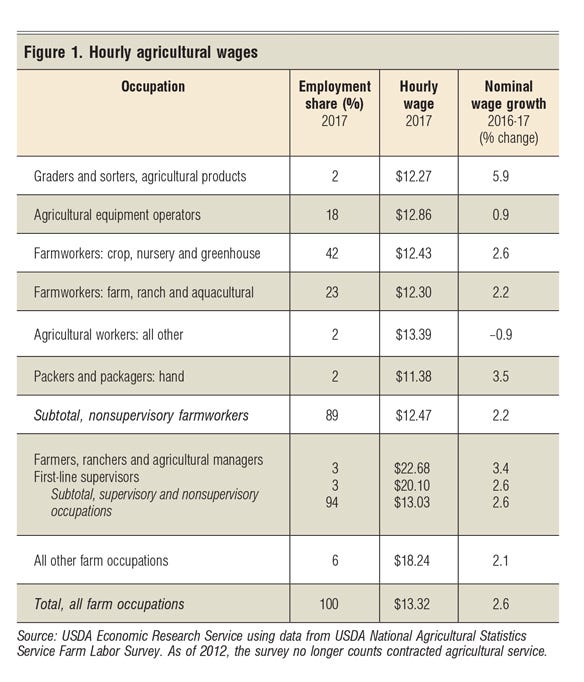
Based on the same data, average nominal hourly wages for hired agricultural managers were $22.68 in 2017, up 3.4% from the prior year (Figure 1). Supervisors received $20.10 per hour, which was 2.6% more year to year.

“Wages of nonsupervisory crop and livestock workers averaged $12.47 per hour in 2017, with little difference between crop and livestock wage rates,” according to ERS. “Real wage growth for these nonsupervisory farmworkers has been faster than for nonsupervisory production workers in the general nonfarm economy.
“In 1989, the average real farm wage for nonsupervisory crop and livestock workers ($9.61 per hour, in 2017 dollars) was 49% less than the average private-sector nonfarm nonsupervisory wage ($18.71). By 2017, this gap had been reduced to 43% ($12.47 for nonsupervisory farmworkers and $22.05 for nonsupervisory non-farmworkers).”
Not counting Hawaii or either coast, according to the latest FLR, hourly wages for livestock workers were highest in the Corn Belt 2 region (Iowa and Missouri) at $14.97, followed by the Mountain 2 region (Colorado, Nevada and Utah) at $14.28 and the Corn Belt I region (Illinois, Indiana and Ohio) at $14.27. They were lowest in Florida and the Southeast, at $11 and $11.01, respectively.
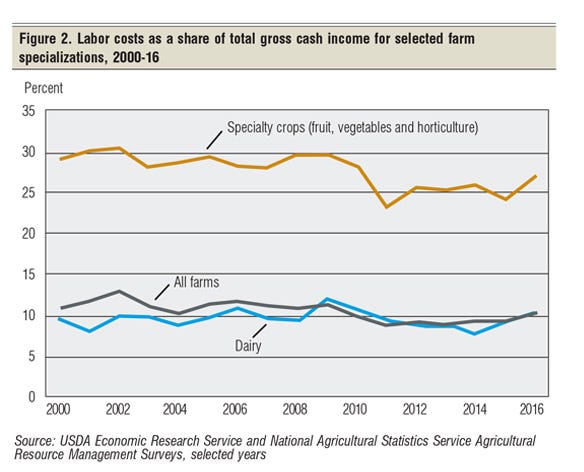
Although nominal wages are increasing, because of increased productivity and higher prices received for output, labor costs as share of gross revenue remain static, according to ERS (Figure 2).

“For all farms, labor costs (including contract labor and fringe benefit costs) averaged 10.1% of gross cash income in 2016, compared to 10.6% to 12.6% for 2000-02,” ERS analysts say. “For the more labor-intensive fruit, vegetable and horticulture operations, the 2016 labor cost share was 26.7%, compared to 28.6% to 30.3% for 2000-02. For farms specializing in dairy, which also relies to a large extent on immigrant labor, the labor cost share was 10.2% in 2016, compared to 7.9% to 9.8% for 2000-02.”
BEEF is exploring these and other issues related to the growing shortage of rural labor in this exclusive BEEF series. Read part one in the series here.
About the Author(s)
You May Also Like


.png?width=300&auto=webp&quality=80&disable=upscale)
