Better business: Analyze your cowherd’s production facts
Many beef producers with spring-born calves have either finished weaning, or will do so soon. How did your year go? By conducting a comparative analysis of your beef cow profit center’s production factors against a set of benchmark herds, you’ll know where things went well. More importantly, you’ll know where you need to improve your operation for better long-term results.
October 30, 2017
By the time you are reading this, many of you will have weaned your 2017 calves and will have your herd’s production data collected, studied and maybe even analyzed for your 2017 calves. Let me suggest one more analysis for your 2017 calves.
I would like to suggest that you conduct a comparative analysis of your beef cow profit center’s production factors against a set of benchmark herds. This management tool works especially well at identifying the production strengths of your herd so that you can capitalize on them. Each herd has a set of unique production strengths.
At the same time, production benchmarking will also identify areas of potential weaknesses in your herd. These are areas where you can then focus your limited management time for improving production next year and the years that follow. Some weaknesses take multiple years to overcome. Your goal should be to have all weaknesses removed by the next peak in the long-run beef price cycle.
The reason that more production benchmarking is not done by ranchers is that they generally do not have access to other beef producers’ herd performance data. North Dakota State University (NDSU) publishes a set of Northern Plains production benchmarks that ranchers around the country can access and use to benchmark their herd’s production performance against. This set of production benchmarks is generated by NDSU’s CHAPS (Cow Herd Appraisal Performance System).
CHAPS 2000 was developed by the North Dakota State University Extension Service through the North Dakota Beef Cattle Improvement Association (NDBCIA), and has been reviewed and approved by the National Cattlemen’s Beef Association National Integrated Resource Management Coordinating Committee.
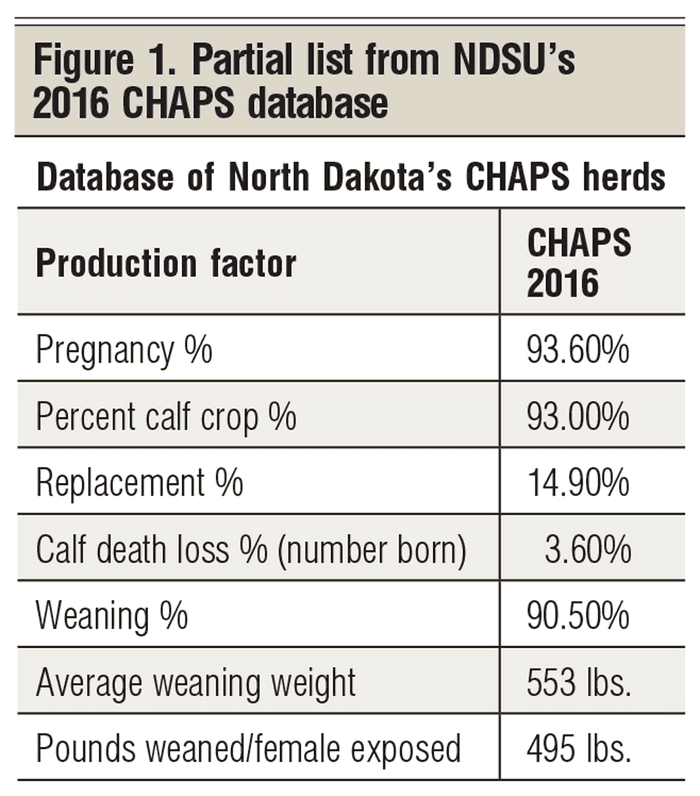
CHAPS 2000 is now being used in several states across the country. I am going to focus on only a portion of the Northern Plains data base (Figure 1).
First, your goal should be to use these benchmark herds to identify your herd’s potential production strengths and your herd’s potential production weaknesses.
Use these potential strengths and potential weaknesses as a guide for focusing your limited management time in these tough economic times.
Benchmark comparisons can help producers identify weaknesses, but benchmarking does not tell producers how to reduce the weaknesses.
You, as the manager, have to determine how to reduce or remove these weaknesses.
The motivation for doing these four steps is that as weaknesses are removed, profits tend to go up.
Figure 1 presents the breeding herd portion of the complete NDSU CHAPS database. This is taken from the 2016 edition of the expanded database. This part of the database deals with reproductive efficiency of the beef cow herd, which is based on the number of females exposed at bull turnout time.
It turns out that the number of females exposed last year is not an easy number for ranchers to come by, because animals are exposed in one year and the calves are weaned the next year. The national Integrated Resource Management Standardized Performance Analysis (IRM SPA) guidelines suggest that production efficiency should be measured by the SPA Adjusted Females Exposed calculation.
This national IRM-SPA guide allows producers to adjust the females exposed for why cows were culled; for purchased females; and for the sale of breeding females. The SPA Adjusted Females Exposed seems to be the most difficult number for ranchers to come up with when analyzing their beef cow herd.
Figure 2 is a simplified worksheet designed to help producers calculate the standardized SPA Adjusted Females Exposed. In summary, you need to quantify the number of females culled from, and the females added to, the breeding herd since bull turnout two years ago.
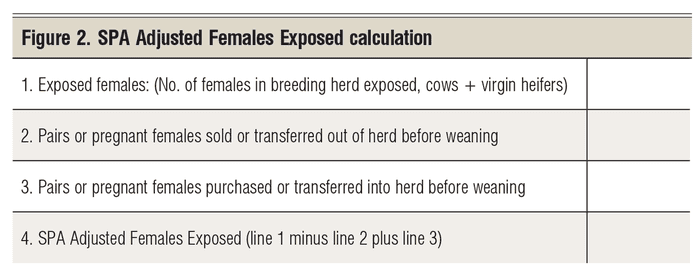
For your 2017 benchmarks, this is the count of breeding females removed or added since bull turnout in 2016; yes, 2016. Add in the breeding cows purchased and subtract out the bred females sold before weaning. Do not subtract out the open cows identified at preg-check time!
This gives you the SPA Adjusted Females Exposed number that you need for benchmarking. Figure 2 can be used as a guide to calculating your SPA Adjusted Females Exposed.
Let’s look at some specific equations designed to help you calculate some critical benchmark values for your herd.
Pregnancy percentage: Pregnancy percentage is based on the number of females checked pregnant divided by the SPA Adjusted Females Exposed. The equation to use is:
Pregnancy % = No. checked preg ÷
SPA Adjusted Females Exposed × 100
Calving rate: Calving rate measures the percentage of the females that had a live calf. Aborts are not included, but stillborns are. Stillborns are also calculated in the calf death loss number. Calving rate is calculated with:
Calving rate % = Cows that calved ÷
SPA Adjusted Females Exposed × 100
Percent calf death loss: Percent calf death loss is one production measure that is not based on females exposed. Percent calf death loss is based on the number of calves born. The formula is:
Calf death loss % = No. dead calves
÷ No. calves born × 100
Percent calf crop: The primary reproductive efficiency measure suggested by the IRM SPA guidelines is the number of live calves weaned, based once again on the SPA Adjusted Females Exposed. The formula is:
Calf crop % = Lives calves weaned
÷ SPA Adjusted Females Exposed × 100
Average weaning weight: Weaning weight is still the most observed production indicator use by the cow-calf sector and does have significant economic importance; however, in my 1990-2008 IRM herd studies, weaning weight statistically explained only 20% of the variation in the unit cost of production. Something else determines the variation in unit cost of producing a hundredweight of calf.
Pounds of calf weaned per female exposed: This is the most important number statistically from my IRM studies that you can measure on a herd. The CHAPS database average is 495 pounds per female exposed. North Dakota’s Farm Business Management 10-year (2007-2016) average of 1,050 herds is 492 pounds. My 1990-2008 IRM Database study indicates that the unit cost of producing a hundredweight of calf goes down as pounds weaned per female exposed goes up. The formula is:
Pounds weaned/female exposed =
Total weaned pounds ÷ SPA Adjusted Females Exposed
Now that you have completed your benchmarking factors, use Figure 3 to summarize your benchmarking data. Enter your herd’s production values, enter the CHAPS average benchmark values, and then calculate your herd’s percent of the benchmark values.
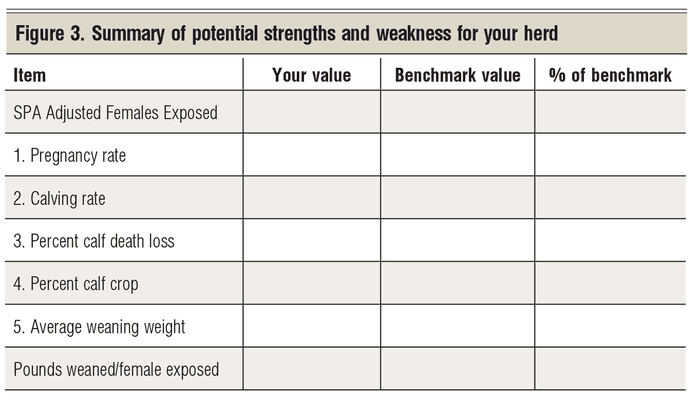
Those production items with a percentage over 100 are candidates for your herd’s strengths. Those items with a percentage less than 100 are prime candidates to be your herd’s weaknesses. Capitalize on your strengths and see if you can remove some or all of your weaknesses. Then, check your progress with your data analysis next year.
Remember, you as the manager have the final say on what your herd’s strengths are, and what its weaknesses are. Benchmarking is only the management tool — albeit a powerful management tool.
Hughes is a North Dakota State University professor emeritus. He lives in Kuna, Idaho. Reach him at 701-238-9607 or [email protected].
About the Author(s)
You May Also Like




.png?width=300&auto=webp&quality=80&disable=upscale)
