Did COOL impact the price/demand relationship for beef?
Cheerleaders for COOL have been louder than normal lately as Congress works to pass the USMCA trade agreement. But was there any actual relationship between price and demand because of COOL? Here’s a look at the data.
September 17, 2019

The new USMCA (U.S., Mexico, Canada) trade agreement – often referred to as NAFTA 2.0 - has been a key topic in the news of late as Congress returns to work following the August recess. Clearly, it has large implications for all stakeholders.
Meanwhile, it’s spurred efforts by some in the industry to campaign once again for mandatory country of origin labeling (COOL). That is, they believe that COOL should be part of the final agreement. Much of that argument is based upon the argument that COOL was beneficial for the cattle market. And proponents always point to the price run in ’13, ’14 and ’15 as supportive evidence.
The influence of COOL on imports and prices has been addressed previously in this column. Several key factors are important amidst that discussion. Most important, the beef cow inventory averaged just 29.34 million head during those three years – the lowest count since 1962.
Correspondingly, beef production plunged to just 23.76 billion pounds in 2015 - a 9% decline versus 2008, the year prior to COOL implementation. Those supply forces were clearly supportive to the market.
Meanwhile, since 2015, beef production has surged 13% in just three years to nearly 27 billion pounds – thereby explaining softer prices in the following years.
All that aside, COOL wasn’t really passed by Congress to benefit the livestock industry. Rather, it was intended to bring value for consumers – promoted on the principles of a consumer’s “right to know” the origin of meat purchased at the retail level. The premise being COOL would provide consumers with important and meaningful information about the meat products they purchase – with the hope consumers would respond accordingly.
However, it didn’t turn out that way. In late 2012, Kansas State University reported that:
Consumer demand for covered meat products was not impacted by COOL; and
U.S. residents were unaware of COOL and did not look for meat origin information.
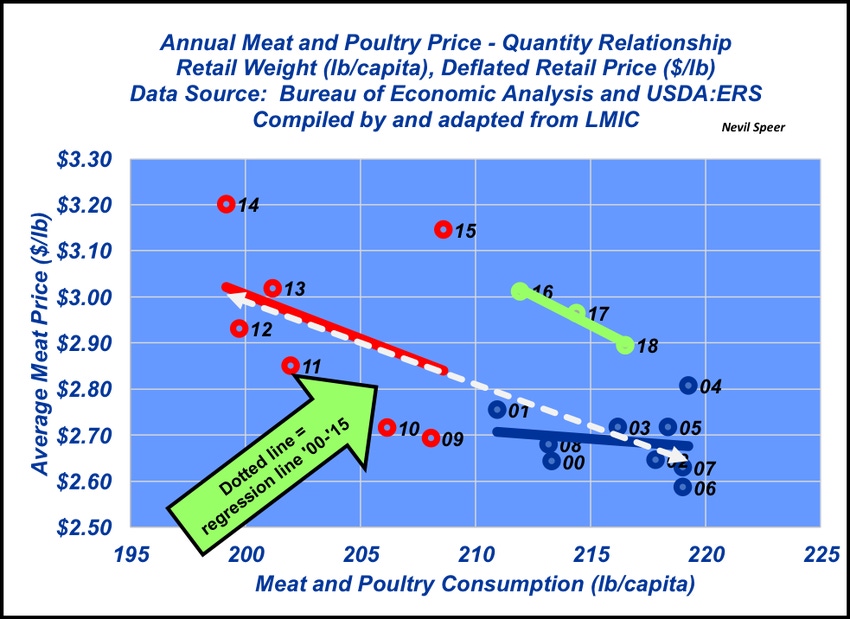
To that end, this week’s illustration provides even more context around that reality and underscores the accuracy of those conclusions.

The graph depicts meat consumption (pork, poultry and beef combined as the law covered all meat products) versus price data. The data are represented across several different time spans for comparative purposes:
’00 – ’08 – the years leading up to COOL
’09 – ’15 – COOL labeling laws were in effect
’16 – ’18 – the span since COOL has been rescinded
’00 – ’15 – combining COOL vs. non-COOL years
What’s important to note here being the regression line (essentially a demand curve) during the COOL years (’09-’15) is nearly identical to the one which covers the entire ’00-’15 time period. In other words, COOL did NOT influence the price/consumption relationship.
However, since 2015, the relationship has changed! The regression line (i.e. demand curve) has moved up and to the right. That’s an indication of selling more product at higher prices – the very definition of improved aggregate demand – all the while COOL hasn’t been in effect.
Speer serves as an industry consultant and is based in Bowling Green, Ky. Contact him at [email protected]
About the Author(s)
You May Also Like


.png?width=300&auto=webp&quality=80&disable=upscale)
