Cattle cycle is here to stay; time to start strategizing
Harlan is kicking of a series of articles dedicated to analyzing the cattle cycle (it's finally back!) and the beef price cycle to hopefully help you build a strategic business plan for the next cattle cycle.
September 6, 2018
A fairly strong argument can be made that the cattle cycle has now returned to the cattle industry. BSE in 2003 and then ethanol in 2007 really upset the cattle industry. Bring in the droughts of 2002 and 2006, and the cattle cycle was basically destroyed.
However, during the last decade or so, the cattle cycle has returned. Remember, the cattle cycle and the beef price cycle are related.
To help sort all that out, I’ll do a series of articles and will devote the first two Market Adviser columns in this series to a detailed economic analysis of the beef cow enterprise for the first nine years of the current cycle.
The first six years of this analysis cover the upward portion of the current beef price cycle; the last three years in this discussion cover the beginning of the downward portion of the current beef price cycle. There could be one or two more years of the downward portion of the current beef price cycle, and then it is projected to start all over again.
According to USDA, the 2018 calf crop is currently estimated at 36.5 million head, 1.9% higher than in 2017. This is the largest calf crop since 2007, and this should bolster cattle slaughter well into 2019.
The good news is that more heifers have been moving into feedlots. Coupling this with the current increased cow slaughter, and the end of this current cattle cycle could come in 2019.
I suggest that the profit-maximizing strategy for the current downward portion of the beef price cycle is different than the profit-maximizing strategy for the upward portion of the beef price cycle.
Let’s now review in detail the first nine years — 2009 through 2017 — of the current cattle cycle. I’ll use cow herd numbers from North Dakota’s farm business management data for this study.
Gross income for the first nine years of this cycle. Gross income is calculated as the sum of beef calves sold, calves transferred out to other enterprises, cull sales (cows and bulls), and breeding herd inventory change. Breeding herd inventory change can be positive or negative, depending on the management strategy of the individual herds.
During the last nine years — 2009-2017 — gross income per cow averaged $1,027 per year. Figure 1 presents the nine-year annual gross income pattern for these North Dakota study herds in this database.
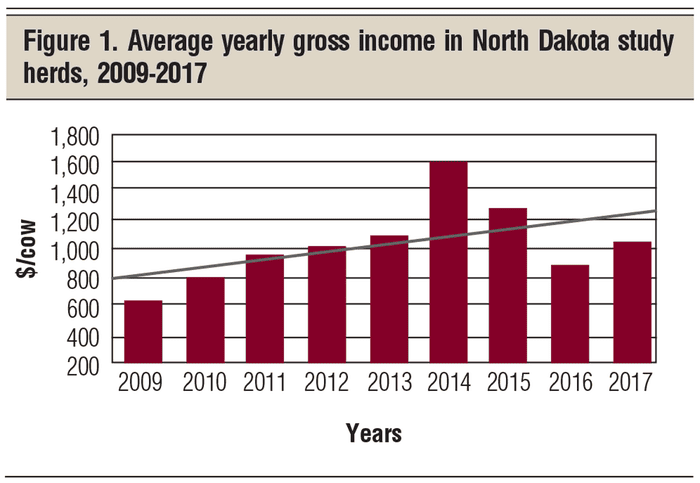
Gross income trended upward $53 per year over the nine-year period, with the peak in gross income in 2014 at $1,602 per cow. Years like 2014 occur maybe one or twice in a rancher’s lifetime.
The drop in gross income per cow since 2014 is stimulating the increased culling of beef cows; however, there is a significant lag time built in before beef cow numbers are actually reduced in response to lower calf prices.
The overall key characteristic of the first half of this beef price cycle is that gross income increases each year for the first six years. The downward side of the beef price cycle appears to be more volatile, but I am currently projecting 2018 gross income per cow to be only slightly less than 2017. That’s because, in spite of the large number of cattle on feed, beef exports are helping out in 2018.
Total direct costs of production. Direct costs of production include all feed costs with farm-raised feed costs valued at market price, not costs of production. Grazing costs are figured at the local grass rental rate. Profit or loss from raising farm-grown feeds is credited to the farming enterprises, not beef cows.
Veterinary and supply costs are included, as are fuel and oil, repairs, custom hire, marketing and operating interest related to beef cows only. These last categories are the beef cow herd’s share only — not farming costs.
Farming expenses are not included, as they are built into the market price of farm-raised feeds fed. Finally, costs of replacement heifers and replacement bulls are also included in the cow herd’s direct cost of production.
The nine-year average direct cost per cow was $723, but does vary by year (Figure 2). In general, average direct cost went up $23 per cow per year and actually peaked in 2015. About half of the increase in gross income per year went for increased direct costs of production.
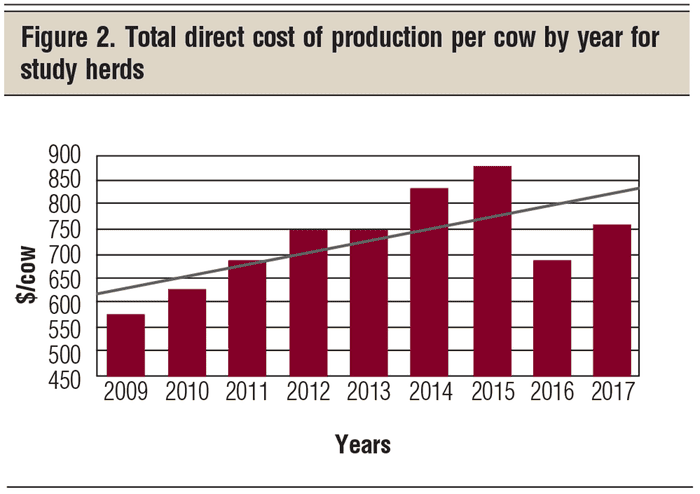
The continued increase in direct costs of production in 2015 over 2014, coupled with the drop in gross income in 2015, got the attention of cattle producers. Direct costs of production went down in 2016 and again in 2017. Cow-calf producers are feeling the pressure of the downward side of the beef price cycle.
One bigger direct cost of production is the cost of replacement heifers and replacement bulls (Figure 3). The trend line for replacement costs was almost flat, suggesting little impact from the beef price cycle. However, the cost of replacement heifers in 2015 was record-high. My Wyoming-Nebraska study herd has also experienced this.
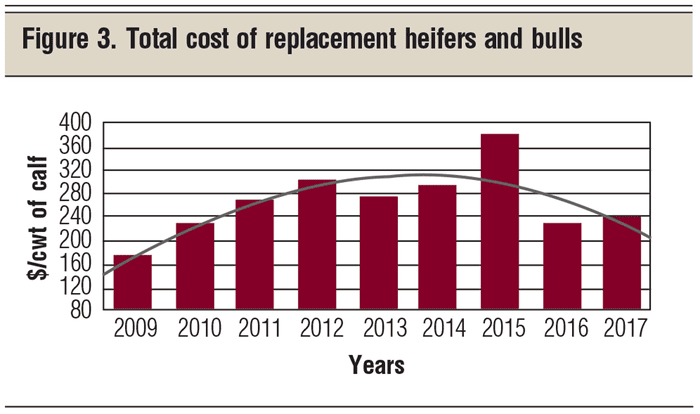
Herd replacement, herd expansion or herd establishment in 2015 were all high-cost investments. These females will calve most of their productive life during the low part of the current beef price cycle and even into the low price years of the next beef price cycle. Some of these 2015 females will even be culled during the low cull cow prices. Remember, in my previous article I suggested cull cow price was a very important component to the overall value of a beef cow.
It’s a different ballgame on the downward side of the beef price cycle. The truth is that most of the beef cow profits are made on the upward portion of the beef price cycle — in this current cycle, that’s 2009 through 2014. The downward side is not near as profitable or as much fun.
Next month, I’ll look at overhead costs, labor and management costs, and earned net returns over the nine study years of these North Dakota herds. I hope to end this series of articles with a 10-year simulation example of my western Wyoming-western Nebraska study herd’s projected economic performance going into the next cattle cycle. I also plan on integrating the farming enterprises into my study herd’s analysis and projections to represent the total farm and ranch business — cow herd and farming.
Hopefully, I can stimulate your thinking about your production strategy going into the next cattle cycle. Now is the time to build a strategic business plan for the next cattle cycle.
Hughes is a North Dakota State University professor emeritus. He lives in Kuna, Idaho. Reach him at 701-238-9607 or [email protected].
About the Author(s)
You May Also Like


.png?width=300&auto=webp&quality=80&disable=upscale)
